Agents and business managers of artists, performers, and athletes
Agents and business managers of artists, performers, and athletes - Job Description, Average Salaries, Career Opportunities, Job Opportunities, National Labor Statistics, Injuries and Education Requirements.
Agents and business managers of artists, performers, and athlete Job Description
Agents and business managers of artists, performers, and athletes manage engagements, performances, appearances, endorsements and other activities for their clients.
Number of People with Agents and business managers of artists, performers, and athlete Jobs in U.S. 2003 - 2009

| Agents and business managers of artists, performers, and athletes: Number of workers 2003 - 2009 | |
|---|---|
| 2003 | No Data Available |
| 2004 | No Data Available |
| 2005 | No Data Available |
| 2006 | No Data Available |
| 2007 | 23,000 |
| 2008 | 28,000 |
| 2009 | 20,000 |
Number of Males with Agents and business managers of artists, performers, and athlete Jobs in U.S. 2003 - 2009
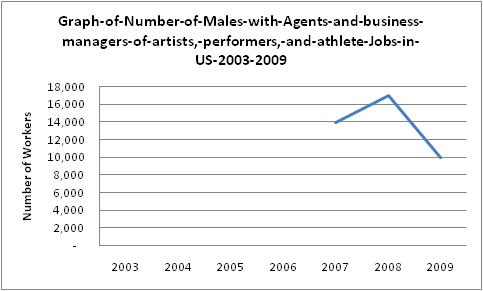
| Agents and business managers of artists, performers, and athletes: Number of Male Workers 2003 - 2009 | |
|---|---|
| 2003 | No Data Available |
| 2004 | No Data Available |
| 2005 | No Data Available |
| 2006 | No Data Available |
| 2007 | 14,000 |
| 2008 | 17,000 |
| 2009 | 10,000 |
Number of Females with Agents and business managers of artists, performers, and athlete Jobs in U.S. 2003 - 2009
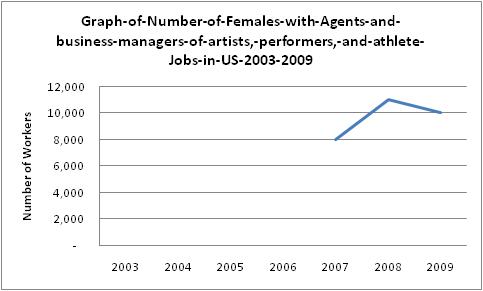
| Agents and business managers of artists, performers, and athletes: Number of Female Workers 2003 - 2009 | |
|---|---|
| 2003 | No Data Available |
| 2004 | No Data Available |
| 2005 | No Data Available |
| 2006 | No Data Available |
| 2007 | 8,000 |
| 2008 | 11,000 |
| 2009 | 10,000 |
Average Annual Salary for Agents and business managers of artists, performers, and athlete Jobs 2003 - 2009
| Agents and business managers of artists, performers, and athletes: Average Annual Salary 2003 - 2009 | |
|---|---|
| 2003 | No Data Available |
| 2004 | No Data Available |
| 2005 | No Data Available |
| 2006 | No Data Available |
| 2007 | No Data Available |
| 2008 | No Data Available |
| 2009 | No Data Available |
Average Annual Salary for Male Agents and business managers of artists, performers, and athlete Jobs 2003 - 2009
| Agents and business managers of artists, performers, and athletes: Average Male Annual Salary 2003 - 2009 | |
|---|---|
| 2003 | No Data Available |
| 2004 | No Data Available |
| 2005 | No Data Available |
| 2006 | No Data Available |
| 2007 | No Data Available |
| 2008 | No Data Available |
| 2009 | No Data Available |
Average Annual Salary for Female Agents and business managers of artists, performers, and athlete Jobs 2003 - 2009
| Agents and business managers of artists, performers, and athletes: Average Female Annual Salary 2003 - 2009 | |
|---|---|
| 2003 | No Data Available |
| 2004 | No Data Available |
| 2005 | No Data Available |
| 2006 | No Data Available |
| 2007 | No Data Available |
| 2008 | No Data Available |
| 2009 | No Data Available |
| Projected Job Openings for Agents and business managers of artists, performers, and athletes | |
|---|---|
| Projected Employment, 2018 | 27,800 |
| Number of New Hires | 5,100 |
| Percent Change | 22 % |
| Total Job Opportunities Due to Growth and Replacement Through 2018 | 10,100 |
How to Become a Agents and business managers of artists, performers, and athlete: Educational Background for Agents and business managers of artists, performers, and athletes in the U.S.

| Most Significant Source of Education for Agents and business managers of artists, performers, and athletes | |
|---|---|
| Less than High School Diploma | 3% |
| High school Diploma or Equivalent | 15% |
| Some College, No Degree | 20% |
| Associate's Degree | 6% |
| Bachelor's Degree | 42% |
| Master's Degree | 10% |
| Doctoral or Professional Degree | 4% |
Other data sources show the following industry statistics:
Employment for Agents and business managers of artists, performers, and athletes in the U.S. for 1997 - 2009
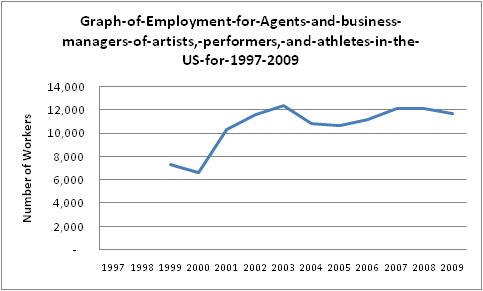
| Employment for Agents and business managers of artists, performers, and athletes 1997 - 2009 | |
|---|---|
| 1997 | No Data Available |
| 1998 | No Data Available |
| 1999 | 7,280 |
| 2000 | 6,600 |
| 2001 | 10,270 |
| 2002 | 11,590 |
| 2003 | 12,380 |
| 2004 | 10,860 |
| 2005 | 10,640 |
| 2006 | 11,130 |
| 2007 | 12,110 |
| 2008 | 12,110 |
| 2009 | 11,700 |
Average Annual Salary for Agents and business managers of artists, performers, and athletes for 1997 - 2009
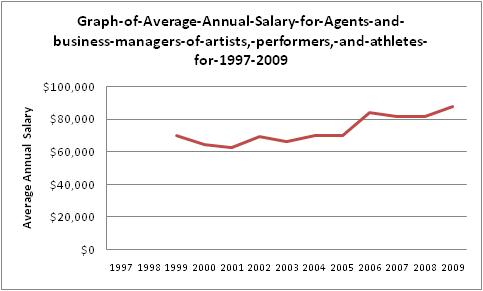
| Average Annual Salary for Agents and business managers of artists, performers, and athletes for 1997 - 2009 | |
|---|---|
| 1997 | No Data Available |
| 1998 | No Data Available |
| 1999 | $69,740 |
| 2000 | $64,080 |
| 2001 | $62,480 |
| 2002 | $68,970 |
| 2003 | $66,160 |
| 2004 | $69,520 |
| 2005 | $70,060 |
| 2006 | $84,070 |
| 2007 | $81,550 |
| 2008 | $81,550 |
| 2009 | $87,430 |
Graph of Average Hourly Salary for Agents and business managers of artists, performers, and athletes for 1997 - 2009
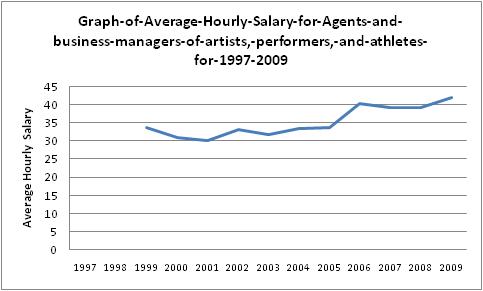
| Average Hourly Salary for Agents and business managers of artists, performers, and athletes for 1997 - 2009 | |
|---|---|
| 1997 | No Data Available |
| 1998 | No Data Available |
| 1999 | $33.53 |
| 2000 | $30.81 |
| 2001 | $30.04 |
| 2002 | $33.16 |
| 2003 | $31.81 |
| 2004 | $33.42 |
| 2005 | $33.68 |
| 2006 | $40.42 |
| 2007 | $39.21 |
| 2008 | $39.21 |
| 2009 | $42.04 |
Table of Average Salary by State (Ordered Higest-Paying to Lowest-Paying) for Agents and business managers of artists, performers, and athletes for 2009
| California | $114,300 |
| Connecticut | $107,260 |
| New York | $102,960 |
| Illinois | $91,970 |
| Massachusetts | $91,330 |
| Michigan | $87,220 |
| Tennessee | $82,970 |
| Alabama | $74,300 |
| Indiana | $74,170 |
| Texas | $71,630 |
| Georgia | $64,030 |
| Ohio | $63,260 |
| Colorado | $61,820 |
| Pennsylvania | $61,500 |
| South Carolina | $61,430 |
| Minnesota | $61,160 |
| Virginia | $60,290 |
| Wisconsin | $56,690 |
| Nevada | $54,300 |
| Arizona | $54,230 |
| Maryland | $52,940 |
| Iowa | $51,510 |
| Florida | $49,950 |
| North Carolina | $48,340 |
| District of Columbia | $46,450 |
| Missouri | $45,410 |
| Utah | $43,640 |
| Oklahoma | $43,100 |
| Louisiana | $38,050 |
| New Jersey | $0 |
| Oregon | $0 |
| BLANK | BLANK |
| BLANK | BLANK |
| BLANK | BLANK |
| BLANK | BLANK |
| BLANK | BLANK |
| BLANK | BLANK |
| BLANK | BLANK |
| BLANK | BLANK |
| BLANK | BLANK |
| BLANK | BLANK |
| BLANK | BLANK |
| BLANK | BLANK |
| BLANK | BLANK |
| BLANK | BLANK |
| BLANK | BLANK |
| BLANK | BLANK |
| BLANK | BLANK |
| BLANK | BLANK |
| BLANK | BLANK |
| BLANK | BLANK |
| BLANK | BLANK |
| BLANK | BLANK |
| BLANK | BLANK |
Table of On-the-job Fatalities for Agents and business managers of artists, performers, and athletes for 2009
| On-the-job Fatalities for Agents and business managers of artists, performers, and athletes for 2009 | |
|---|---|
| Total Fatalities | No Data Available |
| Transportation Incidents | No Data Available |
| Assaults and Violent Acts | No Data Available |
| Contact with Objects and Equipment | No Data Available |
| Falls | No Data Available |
| Exposure to Harmful Substances or Environment | No Data Available |
| Fires and Explosions | No Data Available |