Compensation, benefits, and job analysis specialists
Compensation, benefits, and job analysis specialists - Job Description, Average Salaries, Career Opportunities, Job Opportunities, National Labor Statistics, Injuries and Education Requirements.
Compensation, benefits, and job analysis specialists Job Description
Compensation and benefits specialists oversee programs that deal with employee compensation and benefits, such as retirement plans and health care insurance. Job analysis specialists evaluate the skills and knowledge needed to perform a job to help develop a job description.
Employment for Compensation, benefits, and job analysis specialists in the U.S. for 1997 - 2009

| Employment for Compensation, benefits, and job analysis specialists 1997 - 2009 | |
|---|---|
| 1997 | No Data Available |
| 1998 | No Data Available |
| 1999 | 78,310 |
| 2000 | 84,040 |
| 2001 | 81,450 |
| 2002 | 85,880 |
| 2003 | 86,450 |
| 2004 | 92,940 |
| 2005 | 97,740 |
| 2006 | 103,870 |
| 2007 | 116,250 |
| 2008 | 116,250 |
| 2009 | 111,890 |
Average Annual Salary for Compensation, benefits, and job analysis specialists for 1997 - 2009
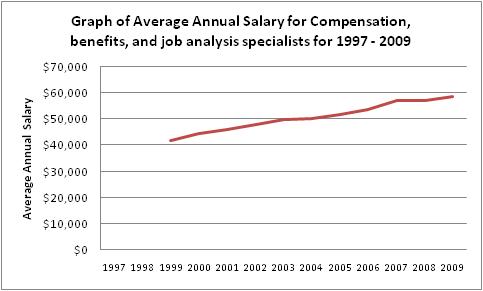
| Average Annual Salary for Compensation, benefits, and job analysis specialists for 1997 - 2009 | |
|---|---|
| 1997 | No Data Available |
| 1998 | No Data Available |
| 1999 | $41,800 |
| 2000 | $44,450 |
| 2001 | $45,950 |
| 2002 | $47,920 |
| 2003 | $49,620 |
| 2004 | $50,130 |
| 2005 | $51,750 |
| 2006 | $53,500 |
| 2007 | $57,060 |
| 2008 | $57,060 |
| 2009 | $58,520 |
Graph of Average Hourly Salary for Compensation, benefits, and job analysis specialists for 1997 - 2009

| Average Hourly Salary for Compensation, benefits, and job analysis specialists for 1997 - 2009 | |
|---|---|
| 1997 | No Data Available |
| 1998 | No Data Available |
| 1999 | $20.09 |
| 2000 | $21.37 |
| 2001 | $22.09 |
| 2002 | $23.04 |
| 2003 | $23.86 |
| 2004 | $24.10 |
| 2005 | $24.88 |
| 2006 | $25.72 |
| 2007 | $27.43 |
| 2008 | $27.43 |
| 2009 | $28.13 |
Table of Average Salary by State (Ordered Higest-Paying to Lowest-Paying) for Compensation, benefits, and job analysis specialists for 2009
| District of Columbia | $76,900 |
| New Jersey | $66,120 |
| Massachusetts | $65,650 |
| Washington | $65,400 |
| New York | $64,160 |
| California | $64,070 |
| Delaware | $64,060 |
| Connecticut | $63,960 |
| Michigan | $60,880 |
| Illinois | $60,790 |
| Alaska | $60,500 |
| Colorado | $60,490 |
| Virginia | $60,090 |
| New Mexico | $59,570 |
| Nevada | $59,530 |
| Texas | $59,280 |
| Minnesota | $59,200 |
| Maryland | $59,020 |
| Rhode Island | $58,990 |
| Georgia | $56,730 |
| Kentucky | $56,470 |
| Pennsylvania | $56,010 |
| North Carolina | $55,720 |
| Tennessee | $55,290 |
| Nebraska | $54,920 |
| Indiana | $54,880 |
| Ohio | $54,070 |
| Arizona | $53,910 |
| North Dakota | $52,950 |
| Hawaii | $52,760 |
| Vermont | $52,510 |
| New Hampshire | $52,450 |
| Oregon | $52,140 |
| Kansas | $51,940 |
| Florida | $51,840 |
| Missouri | $51,490 |
| South Carolina | $51,420 |
| Wyoming | $50,210 |
| Maine | $49,610 |
| Utah | $49,580 |
| Wisconsin | $49,190 |
| Alabama | $49,140 |
| Idaho | $47,600 |
| Montana | $47,380 |
| Iowa | $46,930 |
| West Virginia | $46,690 |
| Louisiana | $46,010 |
| Arkansas | $45,190 |
| South Dakota | $44,170 |
| Oklahoma | $44,170 |
| Mississippi | $42,730 |
| Puerto Rico | $35,340 |
| Guam | $32,520 |