Human resources, training, and labor relations specialists
Human resources, training, and labor relations specialists - Job Description, Average Salaries, Career Opportunities, Job Opportunities, National Labor Statistics, Injuries and Education Requirements.
Human resources, training, and labor relations specialists Job Description
Human resources, training, and labor relations specialists work to attract and retain qualified candidates for job openings. They deal with employee benefits and policies and are closely involved with the hiring of new staff. Increasingly, these specialists may work with corporate management to implement corporate-wide policies to limit employee turnover and increase job satisfaction.
Number of People with Human resources, training, and labor relations specialist Jobs in U.S. 2003 - 2009

| Human resources, training, and labor relations specialists: Number of workers 2003 - 2009 | |
|---|---|
| 2003 | 602,000 |
| 2004 | 612,000 |
| 2005 | 585,000 |
| 2006 | 652,000 |
| 2007 | 731,000 |
| 2008 | 717,000 |
| 2009 | 765,000 |
Number of Males with Human resources, training, and labor relations specialist Jobs in U.S. 2003 - 2009
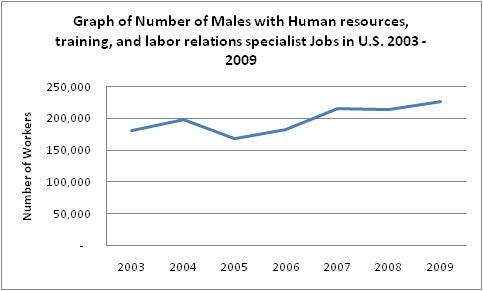
| Human resources, training, and labor relations specialists: Number of Male Workers 2003 - 2009 | |
|---|---|
| 2003 | 181,000 |
| 2004 | 198,000 |
| 2005 | 168,000 |
| 2006 | 182,000 |
| 2007 | 215,000 |
| 2008 | 213,000 |
| 2009 | 226,000 |
Number of Females with Human resources, training, and labor relations specialist Jobs in U.S. 2003 - 2009

| Human resources, training, and labor relations specialists: Number of Female Workers 2003 - 2009 | |
|---|---|
| 2003 | 421,000 |
| 2004 | 415,000 |
| 2005 | 417,000 |
| 2006 | 470,000 |
| 2007 | 517,000 |
| 2008 | 504,000 |
| 2009 | 539,000 |
Average Annual Salary for Human resources, training, and labor relations specialist Jobs 2003 - 2009

| Human resources, training, and labor relations specialists: Average Annual Salary 2003 - 2009 | |
|---|---|
| 2003 | $42,588 |
| 2004 | $41,756 |
| 2005 | $41,132 |
| 2006 | $44,668 |
| 2007 | $45,500 |
| 2008 | $47,736 |
| 2009 | $47,736 |
Average Annual Salary for Male Human resources, training, and labor relations specialist Jobs 2003 - 2009
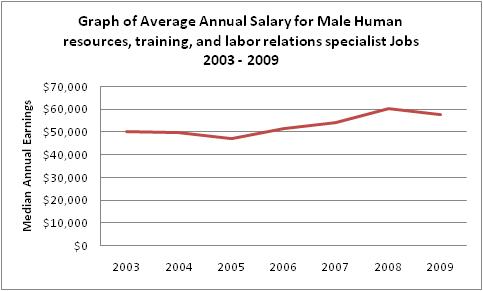
| Human resources, training, and labor relations specialists: Average Male Annual Salary 2003 - 2009 | |
|---|---|
| 2003 | $49,972 |
| 2004 | $49,504 |
| 2005 | $47,008 |
| 2006 | $51,480 |
| 2007 | $53,924 |
| 2008 | $60,216 |
| 2009 | $57,356 |
Average Annual Salary for Female Human resources, training, and labor relations specialist Jobs 2003 - 2009

| Human resources, training, and labor relations specialists: Average Female Annual Salary 2003 - 2009 | |
|---|---|
| 2003 | $40,248 |
| 2004 | $39,260 |
| 2005 | $39,624 |
| 2006 | $41,808 |
| 2007 | $42,172 |
| 2008 | $44,200 |
| 2009 | $43,940 |
| Projected Job Openings for Human resources, training, and labor relations specialists | |
|---|---|
| Projected Employment, 2018 | 955,500 |
| Number of New Hires | 184,500 |
| Percent Change | 24 % |
| Total Job Opportunities Due to Growth and Replacement Through 2018 | 385,800 |
Other data sources show the following industry statistics:
Employment for Human resources, training, and labor relations specialists, all other in the U.S. for 1997 - 2009

| Employment for Human resources, training, and labor relations specialists, all other 1997 - 2009 | |
|---|---|
| 1997 | No Data Available |
| 1998 | No Data Available |
| 1999 | No Data Available |
| 2000 | No Data Available |
| 2001 | No Data Available |
| 2002 | No Data Available |
| 2003 | No Data Available |
| 2004 | 158,930 |
| 2005 | 171,880 |
| 2006 | 204,290 |
| 2007 | 217,440 |
| 2008 | 217,440 |
| 2009 | 219,240 |
Average Annual Salary for Human resources, training, and labor relations specialists, all other for 1997 - 2009
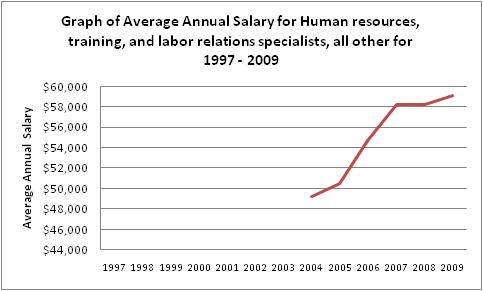
| Average Annual Salary for Human resources, training, and labor relations specialists, all other for 1997 - 2009 | |
|---|---|
| 1997 | No Data Available |
| 1998 | No Data Available |
| 1999 | No Data Available |
| 2000 | No Data Available |
| 2001 | No Data Available |
| 2002 | No Data Available |
| 2003 | No Data Available |
| 2004 | $49,240 |
| 2005 | $50,480 |
| 2006 | $54,700 |
| 2007 | $58,230 |
| 2008 | $58,230 |
| 2009 | $59,070 |
Graph of Average Hourly Salary for Human resources, training, and labor relations specialists, all other for 1997 - 2009
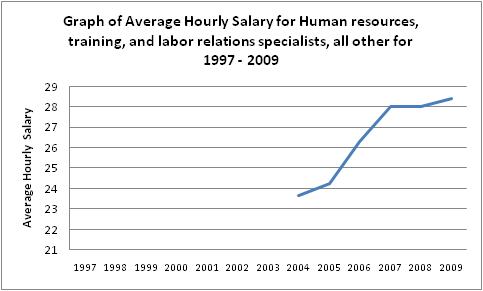
| Average Hourly Salary for Human resources, training, and labor relations specialists, all other for 1997 - 2009 | |
|---|---|
| 1997 | No Data Available |
| 1998 | No Data Available |
| 1999 | No Data Available |
| 2000 | No Data Available |
| 2001 | No Data Available |
| 2002 | No Data Available |
| 2003 | No Data Available |
| 2004 | $23.67 |
| 2005 | $24.27 |
| 2006 | $26.30 |
| 2007 | $28.00 |
| 2008 | $28.00 |
| 2009 | $28.40 |
Table of Average Salary by State (Ordered Higest-Paying to Lowest-Paying) for Human resources, training, and labor relations specialists, all other for 2009
| District of Columbia | $92,940 |
| Maryland | $70,730 |
| Virginia | $69,390 |
| California | $69,130 |
| New Jersey | $68,240 |
| Colorado | $67,850 |
| Connecticut | $66,830 |
| Massachusetts | $65,500 |
| Georgia | $63,220 |
| Washington | $62,350 |
| Mississippi | $62,280 |
| Minnesota | $62,280 |
| New Mexico | $61,850 |
| Alaska | $61,680 |
| New York | $61,360 |
| Oregon | $60,850 |
| Delaware | $60,820 |
| Texas | $60,640 |
| Tennessee | $59,490 |
| Hawaii | $59,300 |
| Kansas | $58,280 |
| North Carolina | $57,200 |
| Vermont | $57,180 |
| Arizona | $57,000 |
| Florida | $56,200 |
| Nevada | $56,060 |
| Wyoming | $56,010 |
| Missouri | $55,980 |
| North Dakota | $55,770 |
| West Virginia | $55,530 |
| South Carolina | $55,180 |
| Utah | $55,070 |
| Idaho | $54,320 |
| Pennsylvania | $53,880 |
| Montana | $53,390 |
| Alabama | $53,270 |
| New Hampshire | $53,170 |
| Virgin Islands | $52,830 |
| Illinois | $52,690 |
| Michigan | $51,480 |
| Arkansas | $50,830 |
| Louisiana | $50,500 |
| Maine | $50,480 |
| Oklahoma | $50,280 |
| Guam | $50,000 |
| Nebraska | $49,450 |
| Iowa | $49,150 |
| Indiana | $47,700 |
| Rhode Island | $47,510 |
| Kentucky | $47,380 |
| Ohio | $46,380 |
| Wisconsin | $39,840 |
| Puerto Rico | $37,700 |