Purchasing agents and buyers of farm products buy farm products to resell or to process them more.
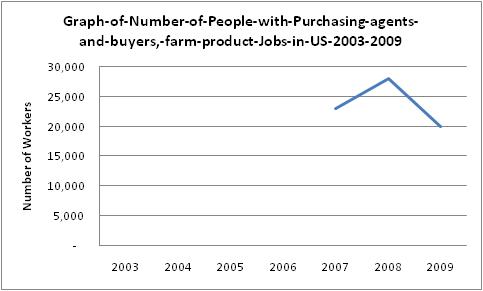
| Purchasing agents and buyers, farm products: Number of workers 2003 - 2009 |
| 2003 | No Data Available |
| 2004 | No Data Available |
| 2005 | No Data Available |
| 2006 | No Data Available |
| 2007 | 23,000 |
| 2008 | 28,000 |
| 2009 | 20,000 |
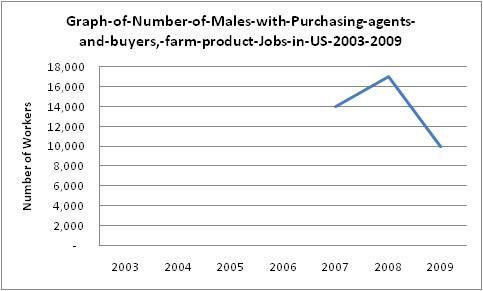
| Purchasing agents and buyers, farm products: Number of Male Workers 2003 - 2009 |
| 2003 | No Data Available |
| 2004 | No Data Available |
| 2005 | No Data Available |
| 2006 | No Data Available |
| 2007 | 14,000 |
| 2008 | 17,000 |
| 2009 | 10,000 |
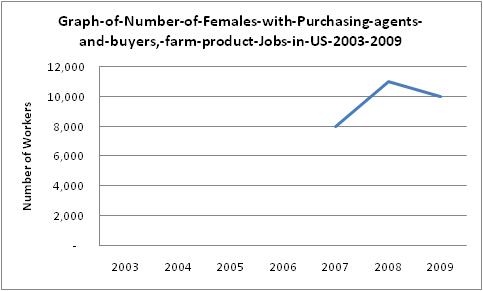
| Purchasing agents and buyers, farm products: Number of Female Workers 2003 - 2009 |
| 2003 | No Data Available |
| 2004 | No Data Available |
| 2005 | No Data Available |
| 2006 | No Data Available |
| 2007 | 8,000 |
| 2008 | 11,000 |
| 2009 | 10,000 |
| Projected Job Openings for Purchasing agents and buyers, farm products |
| Projected Employment, 2018 | 27,800 |
| Number of New Hires | 5,100 |
| Percent Change | 22 % |
| Total Job Opportunities Due to Growth and Replacement Through 2018 | 10,100 |
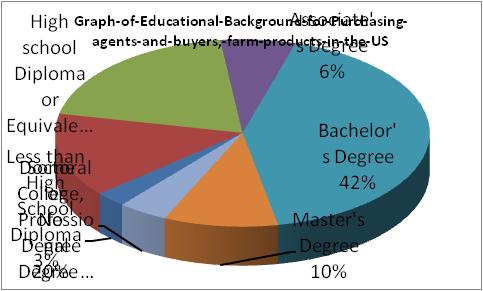
| Most Significant Source of Education for Purchasing agents and buyers, farm products |
| Less than High School Diploma | 3% |
| High school Diploma or Equivalent | 15% |
| Some College, No Degree | 20% |
| Associate's Degree | 6% |
| Bachelor's Degree | 42% |
| Master's Degree | 10% |
| Doctoral or Professional Degree | 4% |
Other data sources show the following industry statistics:
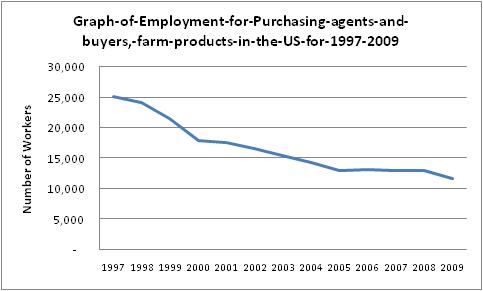
| Employment for Purchasing agents and buyers, farm products 1997 - 2009 |
| 1997 | 25,200 |
| 1998 | 24,160 |
| 1999 | 21,550 |
| 2000 | 17,910 |
| 2001 | 17,640 |
| 2002 | 16,570 |
| 2003 | 15,550 |
| 2004 | 14,300 |
| 2005 | 12,970 |
| 2006 | 13,110 |
| 2007 | 13,010 |
| 2008 | 13,010 |
| 2009 | 11,690 |
| Average Annual Salary for Purchasing agents and buyers, farm products for 1997 - 2009 |
| 1997 | $35,530 |
| 1998 | $36,490 |
| 1999 | $43,840 |
| 2000 | $44,690 |
| 2001 | $45,130 |
| 2002 | $46,930 |
| 2003 | $47,550 |
| 2004 | $49,980 |
| 2005 | $52,970 |
| 2006 | $53,730 |
| 2007 | $58,760 |
| 2008 | $58,760 |
| 2009 | $62,450 |
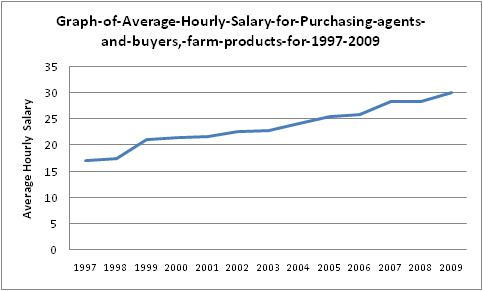
| Average Hourly Salary for Purchasing agents and buyers, farm products for 1997 - 2009 |
| 1997 | $17 |
| 1998 | $18 |
| 1999 | $21.08 |
| 2000 | $21.49 |
| 2001 | $21.70 |
| 2002 | $22.56 |
| 2003 | $22.86 |
| 2004 | $24.03 |
| 2005 | $25.47 |
| 2006 | $25.83 |
| 2007 | $28.25 |
| 2008 | $28.25 |
| 2009 | $30.02 |
| Kansas | $82,920 |
| Connecticut | $79,620 |
| California | $72,480 |
| New Jersey | $68,180 |
| Minnesota | $67,380 |
| Michigan | $65,620 |
| District of Columbia | $63,150 |
| Arizona | $62,690 |
| Virginia | $62,550 |
| Nebraska | $62,010 |
| Kentucky | $61,760 |
| Texas | $61,540 |
| Washington | $60,050 |
| Georgia | $57,540 |
| Colorado | $56,850 |
| Florida | $56,450 |
| Vermont | $56,330 |
| Illinois | $56,220 |
| Oregon | $56,060 |
| Alabama | $55,800 |
| Maryland | $55,670 |
| North Dakota | $55,180 |
| North Carolina | $54,720 |
| Indiana | $54,560 |
| Ohio | $51,630 |
| Arkansas | $51,590 |
| South Dakota | $51,220 |
| South Carolina | $51,060 |
| Hawaii | $50,850 |
| Maine | $50,620 |
| Pennsylvania | $50,600 |
| Iowa | $49,190 |
| New Mexico | $48,050 |
| Tennessee | $46,890 |
| Utah | $45,070 |
| Montana | $44,160 |
| Missouri | $43,880 |
| Oklahoma | $42,780 |
| Idaho | $42,770 |
| Louisiana | $42,570 |
| Puerto Rico | $37,350 |
| Mississippi | $0 |
| Wisconsin | $0 |
| Massachusetts | $0 |