Wholesale and retail buyers, except farm products
Wholesale and retail buyers, except farm products - Job Description, Average Salaries, Career Opportunities, Job Opportunities, National Labor Statistics, Injuries and Education Requirements.
Wholesale and retail buyers, except farm product Job Description
Wholesale and retail buyers, except for farm products, buy goods and products to resell to consumers. They analyze historical prices and trends to determine sales prices and work under buying contracts.
Number of People with Wholesale and retail buyers, except farm product Jobs in U.S. 2003 - 2009
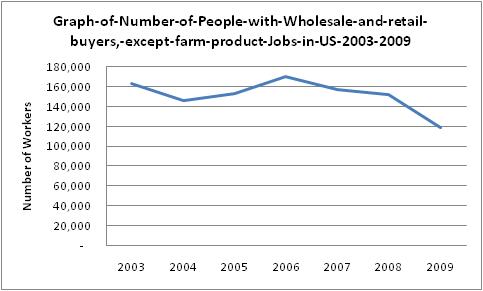
| Wholesale and retail buyers, except farm products: Number of workers 2003 - 2009 | |
|---|---|
| 2003 | 163,000 |
| 2004 | 146,000 |
| 2005 | 153,000 |
| 2006 | 170,000 |
| 2007 | 157,000 |
| 2008 | 152,000 |
| 2009 | 119,000 |
Number of Males with Wholesale and retail buyers, except farm product Jobs in U.S. 2003 - 2009
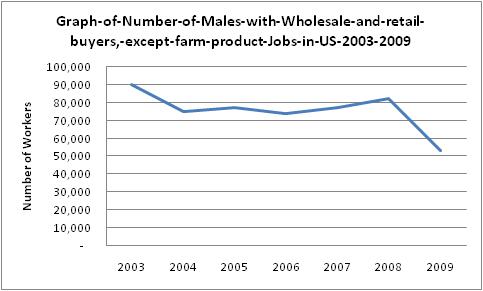
| Wholesale and retail buyers, except farm products: Number of Male Workers 2003 - 2009 | |
|---|---|
| 2003 | 90,000 |
| 2004 | 75,000 |
| 2005 | 77,000 |
| 2006 | 74,000 |
| 2007 | 77,000 |
| 2008 | 82,000 |
| 2009 | 53,000 |
Number of Females with Wholesale and retail buyers, except farm product Jobs in U.S. 2003 - 2009
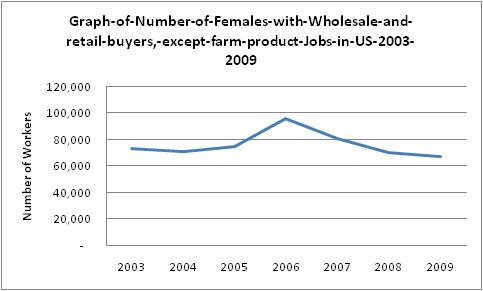
| Wholesale and retail buyers, except farm products: Number of Female Workers 2003 - 2009 | |
|---|---|
| 2003 | 73,000 |
| 2004 | 71,000 |
| 2005 | 75,000 |
| 2006 | 96,000 |
| 2007 | 81,000 |
| 2008 | 70,000 |
| 2009 | 67,000 |
Average Annual Salary for Wholesale and retail buyers, except farm product Jobs 2003 - 2009
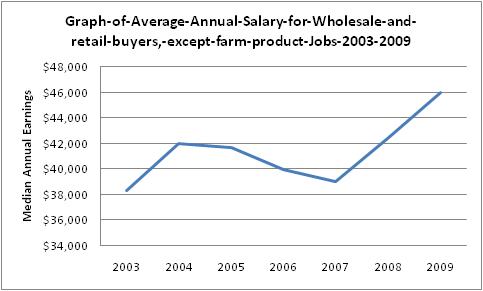
| Wholesale and retail buyers, except farm products: Average Annual Salary 2003 - 2009 | |
|---|---|
| 2003 | $38,324 |
| 2004 | $42,016 |
| 2005 | $41,704 |
| 2006 | $39,988 |
| 2007 | $39,000 |
| 2008 | $42,432 |
| 2009 | $45,968 |
Average Annual Salary for Male Wholesale and retail buyers, except farm product Jobs 2003 - 2009
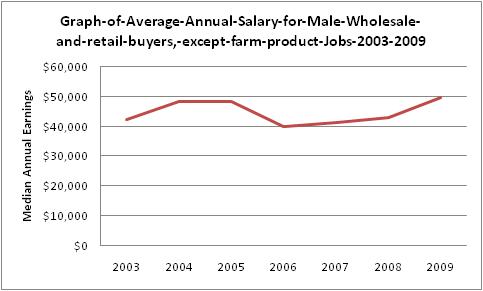
| Wholesale and retail buyers, except farm products: Average Male Annual Salary 2003 - 2009 | |
|---|---|
| 2003 | $42,224 |
| 2004 | $48,620 |
| 2005 | $48,360 |
| 2006 | $39,936 |
| 2007 | $41,288 |
| 2008 | $42,952 |
| 2009 | $49,816 |
Average Annual Salary for Female Wholesale and retail buyers, except farm product Jobs 2003 - 2009
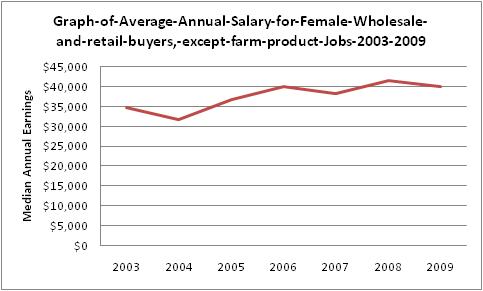
| Wholesale and retail buyers, except farm products: Average Female Annual Salary 2003 - 2009 | |
|---|---|
| 2003 | $34,840 |
| 2004 | $31,668 |
| 2005 | $36,816 |
| 2006 | $40,040 |
| 2007 | $38,324 |
| 2008 | $41,652 |
| 2009 | $40,040 |
| Projected Job Openings for Wholesale and retail buyers, except farm products | |
|---|---|
| Projected Employment, 2018 | 144,400 |
| Number of New Hires | -3,300 |
| Percent Change | -2 % |
| Total Job Opportunities Due to Growth and Replacement Through 2018 | 37,000 |
How to Become a Wholesale and retail buyers, except farm product: Educational Background for Wholesale and retail buyers, except farm products in the U.S.
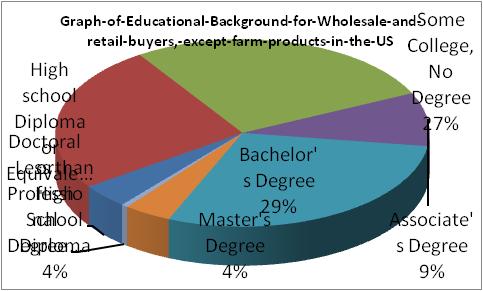
| Most Significant Source of Education for Wholesale and retail buyers, except farm products | |
|---|---|
| Less than High School Diploma | 4% |
| High school Diploma or Equivalent | 25% |
| Some College, No Degree | 27% |
| Associate's Degree | 9% |
| Bachelor's Degree | 29% |
| Master's Degree | 4% |
| Doctoral or Professional Degree | 1% |
Other data sources show the following industry statistics:
Employment for Wholesale and retail buyers, except farm products in the U.S. for 1997 - 2009
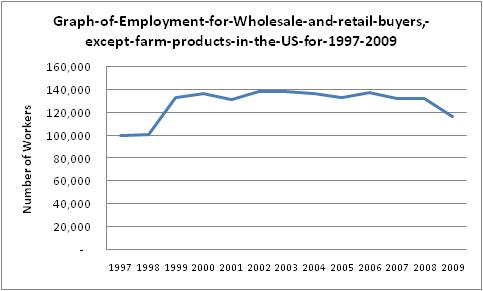
| Employment for Wholesale and retail buyers, except farm products 1997 - 2009 | |
|---|---|
| 1997 | 99,820 |
| 1998 | 100,460 |
| 1999 | 133,070 |
| 2000 | 137,040 |
| 2001 | 131,670 |
| 2002 | 138,380 |
| 2003 | 138,630 |
| 2004 | 136,930 |
| 2005 | 132,900 |
| 2006 | 137,310 |
| 2007 | 132,420 |
| 2008 | 132,420 |
| 2009 | 116,900 |
Average Annual Salary for Wholesale and retail buyers, except farm products for 1997 - 2009
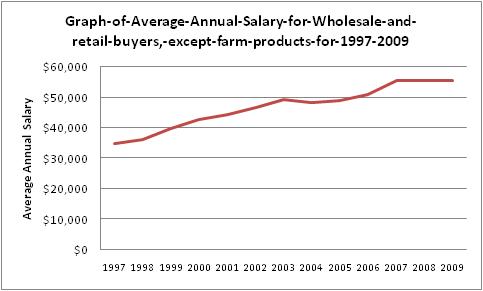
| Average Annual Salary for Wholesale and retail buyers, except farm products for 1997 - 2009 | |
|---|---|
| 1997 | $34,780 |
| 1998 | $36,010 |
| 1999 | $39,770 |
| 2000 | $42,590 |
| 2001 | $44,200 |
| 2002 | $46,650 |
| 2003 | $49,350 |
| 2004 | $48,450 |
| 2005 | $49,050 |
| 2006 | $51,010 |
| 2007 | $55,540 |
| 2008 | $55,540 |
| 2009 | $55,480 |
Graph of Average Hourly Salary for Wholesale and retail buyers, except farm products for 1997 - 2009
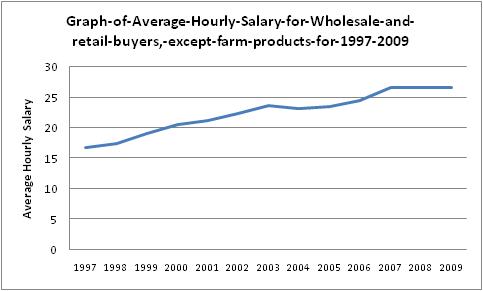
| Average Hourly Salary for Wholesale and retail buyers, except farm products for 1997 - 2009 | |
|---|---|
| 1997 | $17 |
| 1998 | $17 |
| 1999 | $19.12 |
| 2000 | $20.48 |
| 2001 | $21.25 |
| 2002 | $22.43 |
| 2003 | $23.72 |
| 2004 | $23.29 |
| 2005 | $23.58 |
| 2006 | $24.52 |
| 2007 | $26.70 |
| 2008 | $26.70 |
| 2009 | $26.68 |
Table of Average Salary by State (Ordered Higest-Paying to Lowest-Paying) for Wholesale and retail buyers, except farm products for 2009
| New Jersey | $67,330 |
| New York | $65,760 |
| Minnesota | $60,260 |
| Pennsylvania | $59,620 |
| Illinois | $59,340 |
| Massachusetts | $59,230 |
| Georgia | $58,690 |
| Texas | $58,030 |
| Arizona | $57,370 |
| Nevada | $57,120 |
| Colorado | $56,530 |
| Florida | $56,060 |
| Arkansas | $56,000 |
| New Hampshire | $55,680 |
| California | $54,740 |
| Rhode Island | $54,470 |
| Maryland | $54,050 |
| South Carolina | $53,980 |
| Michigan | $53,140 |
| Maine | $52,720 |
| Virginia | $52,310 |
| Ohio | $50,910 |
| North Carolina | $50,520 |
| Alaska | $50,270 |
| Nebraska | $50,170 |
| Tennessee | $49,930 |
| West Virginia | $49,910 |
| Utah | $49,700 |
| Delaware | $49,370 |
| Wisconsin | $48,420 |
| Oregon | $48,380 |
| Kentucky | $48,190 |
| Alabama | $48,130 |
| Louisiana | $48,100 |
| Indiana | $47,050 |
| Mississippi | $46,850 |
| Washington | $46,710 |
| Kansas | $46,160 |
| Vermont | $45,590 |
| Iowa | $44,910 |
| Missouri | $44,820 |
| North Dakota | $44,570 |
| Oklahoma | $44,530 |
| South Dakota | $44,010 |
| New Mexico | $43,940 |
| Idaho | $42,240 |
| Virgin Islands | $41,610 |
| Wyoming | $40,950 |
| Hawaii | $40,480 |
| Montana | $38,830 |
| Puerto Rico | $24,810 |
| Connecticut | $0 |
| District of Columbia | $0 |