Claims adjusters, appraisers, examiners, and investigators
Claims adjusters, appraisers, examiners, and investigators - Job Description, Average Salaries, Career Opportunities, Job Opportunities, National Labor Statistics, Injuries and Education Requirements.
Claims adjusters, appraisers, examiners, and investigators Job Description
Claims adjusters, appraisers, examiners, and investigators review and evaluate insurance policy claims, negotiate settlements and authorize payment of the settled claim.
Number of People with Claims adjusters, appraisers, examiners, and investigator Jobs in U.S. 2003 - 2009

| Claims adjusters, appraisers, examiners, and investigators: Number of workers 2003 - 2009 | |
|---|---|
| 2003 | 258,000 |
| 2004 | 257,000 |
| 2005 | 276,000 |
| 2006 | 255,000 |
| 2007 | 270,000 |
| 2008 | 286,000 |
| 2009 | 253,000 |
Number of Males with Claims adjusters, appraisers, examiners, and investigator Jobs in U.S. 2003 - 2009

| Claims adjusters, appraisers, examiners, and investigators: Number of Male Workers 2003 - 2009 | |
|---|---|
| 2003 | 97,000 |
| 2004 | 85,000 |
| 2005 | 102,000 |
| 2006 | 96,000 |
| 2007 | 106,000 |
| 2008 | 99,000 |
| 2009 | 98,000 |
Number of Females with Claims adjusters, appraisers, examiners, and investigator Jobs in U.S. 2003 - 2009
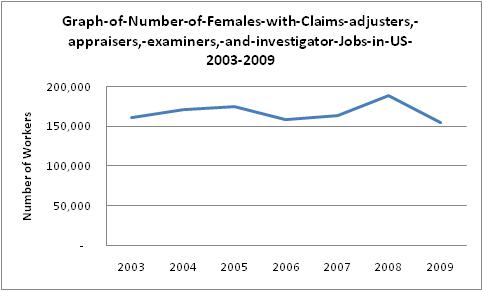
| Claims adjusters, appraisers, examiners, and investigators: Number of Female Workers 2003 - 2009 | |
|---|---|
| 2003 | 161,000 |
| 2004 | 171,000 |
| 2005 | 174,000 |
| 2006 | 159,000 |
| 2007 | 164,000 |
| 2008 | 188,000 |
| 2009 | 155,000 |
Average Annual Salary for Claims adjusters, appraisers, examiners, and investigator Jobs 2003 - 2009

| Claims adjusters, appraisers, examiners, and investigators: Average Annual Salary 2003 - 2009 | |
|---|---|
| 2003 | $38,220 |
| 2004 | $39,624 |
| 2005 | $41,028 |
| 2006 | $44,096 |
| 2007 | $42,068 |
| 2008 | $42,120 |
| 2009 | $48,932 |
Average Annual Salary for Male Claims adjusters, appraisers, examiners, and investigator Jobs 2003 - 2009

| Claims adjusters, appraisers, examiners, and investigators: Average Male Annual Salary 2003 - 2009 | |
|---|---|
| 2003 | $45,136 |
| 2004 | $49,504 |
| 2005 | $50,492 |
| 2006 | $51,064 |
| 2007 | $46,696 |
| 2008 | $46,332 |
| 2009 | $58,656 |
Average Annual Salary for Female Claims adjusters, appraisers, examiners, and investigator Jobs 2003 - 2009
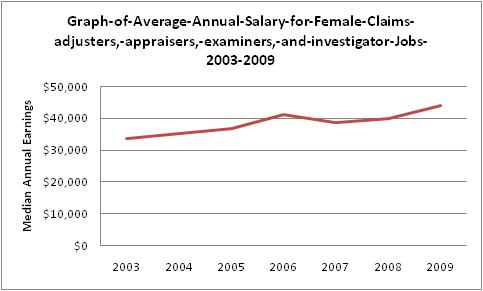
| Claims adjusters, appraisers, examiners, and investigators: Average Female Annual Salary 2003 - 2009 | |
|---|---|
| 2003 | $33,696 |
| 2004 | $35,204 |
| 2005 | $36,712 |
| 2006 | $41,184 |
| 2007 | $38,636 |
| 2008 | $39,832 |
| 2009 | $43,940 |
| Projected Job Openings for Claims adjusters, appraisers, examiners, and investigators | |
|---|---|
| Projected Employment, 2018 | 327,200 |
| Number of New Hires | 20,900 |
| Percent Change | 7 % |
| Total Job Opportunities Due to Growth and Replacement Through 2018 | 98,600 |
Other data sources show the following industry statistics:
Employment for Claims adjusters, examiners, and investigators in the U.S. for 1997 - 2009
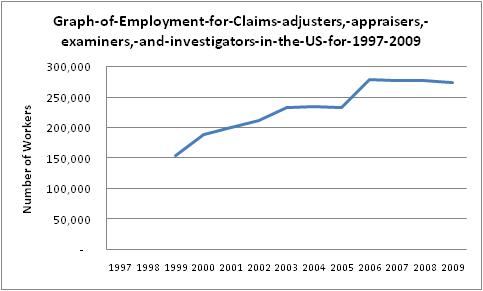
| Employment for Claims adjusters, examiners, and investigators 1997 - 2009 | |
|---|---|
| 1997 | No Data Available |
| 1998 | No Data Available |
| 1999 | 154,770 |
| 2000 | 189,700 |
| 2001 | 200,510 |
| 2002 | 211,960 |
| 2003 | 234,190 |
| 2004 | 234,950 |
| 2005 | 234,030 |
| 2006 | 279,240 |
| 2007 | 277,230 |
| 2008 | 277,230 |
| 2009 | 273,930 |
Average Annual Salary for Claims adjusters, examiners, and investigators for 1997 - 2009
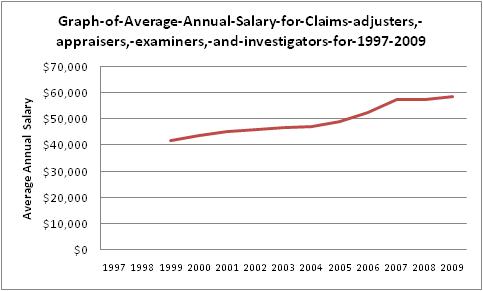
| Average Annual Salary for Claims adjusters, examiners, and investigators for 1997 - 2009 | |
|---|---|
| 1997 | No Data Available |
| 1998 | No Data Available |
| 1999 | $41,960 |
| 2000 | $44,000 |
| 2001 | $45,350 |
| 2002 | $45,990 |
| 2003 | $46,960 |
| 2004 | $47,310 |
| 2005 | $49,210 |
| 2006 | $52,750 |
| 2007 | $57,550 |
| 2008 | $57,550 |
| 2009 | $58,780 |
Graph of Average Hourly Salary for Claims adjusters, examiners, and investigators for 1997 - 2009
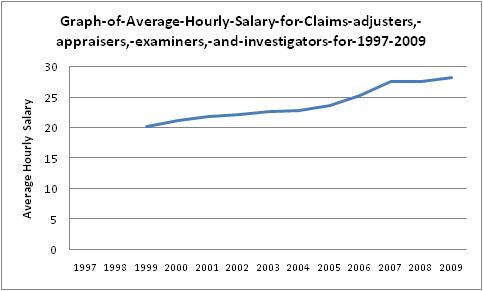
| Average Hourly Salary for Claims adjusters, examiners, and investigators for 1997 - 2009 | |
|---|---|
| 1997 | No Data Available |
| 1998 | No Data Available |
| 1999 | $20.17 |
| 2000 | $21.15 |
| 2001 | $21.80 |
| 2002 | $22.11 |
| 2003 | $22.58 |
| 2004 | $22.74 |
| 2005 | $23.66 |
| 2006 | $25.36 |
| 2007 | $27.67 |
| 2008 | $27.67 |
| 2009 | $28.26 |
Table of Average Salary by State (Ordered Higest-Paying to Lowest-Paying) for Claims adjusters, examiners, and investigators for 2009
| District of Columbia | $77,180 |
| New Jersey | $67,190 |
| Louisiana | $63,630 |
| New York | $63,310 |
| Vermont | $63,300 |
| Maryland | $63,170 |
| California | $62,620 |
| Connecticut | $62,310 |
| Colorado | $62,230 |
| Massachusetts | $61,960 |
| Nevada | $61,290 |
| New Hampshire | $61,010 |
| Illinois | $60,980 |
| Mississippi | $60,400 |
| Washington | $59,560 |
| Indiana | $59,170 |
| Pennsylvania | $58,730 |
| Arizona | $58,340 |
| Ohio | $58,120 |
| Michigan | $57,980 |
| Oregon | $57,970 |
| Rhode Island | $57,960 |
| Texas | $57,820 |
| Alaska | $57,590 |
| Alabama | $57,520 |
| North Carolina | $57,160 |
| New Mexico | $57,020 |
| Georgia | $56,860 |
| Wisconsin | $55,920 |
| South Dakota | $55,730 |
| Missouri | $55,490 |
| Tennessee | $55,340 |
| West Virginia | $54,950 |
| Delaware | $54,780 |
| Florida | $54,570 |
| Virginia | $54,410 |
| Kentucky | $54,380 |
| Maine | $53,890 |
| Kansas | $53,700 |
| South Carolina | $53,600 |
| Montana | $53,340 |
| Idaho | $52,890 |
| Utah | $52,670 |
| Hawaii | $52,500 |
| Iowa | $52,480 |
| Minnesota | $51,480 |
| Nebraska | $51,480 |
| Wyoming | $51,210 |
| North Dakota | $49,970 |
| Oklahoma | $49,080 |
| Arkansas | $48,670 |
| Guam | $39,410 |
| Puerto Rico | $36,080 |