Administrative services managers - Job Description, Average Salaries, Career Opportunities, Job Opportunities, National Labor Statistics, Injuries and Education Requirements.
Administrative services manager Job Description
Administrative service managers coordinate the administrative and operational functions of a company or organization, including things such as procurement, mail, space usage, records, and facility maintenance.
Graph of Number of People with Administrative services manager Jobs in U.S. 2003 - 2009
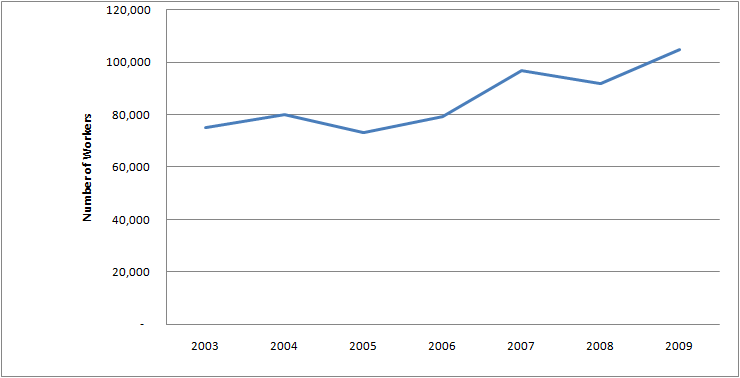
| Administrative services managers: Number of workers 2003 - 2009 | |
|---|---|
| 2003 | 75,000 |
| 2004 | 80,000 |
| 2005 | 73,000 |
| 2006 | 79,000 |
| 2007 | 97,000 |
| 2008 | 92,000 |
| 2009 | 105,000 |
Graph of Number of Males with Administrative services manager Jobs in U.S. 2003 - 2009
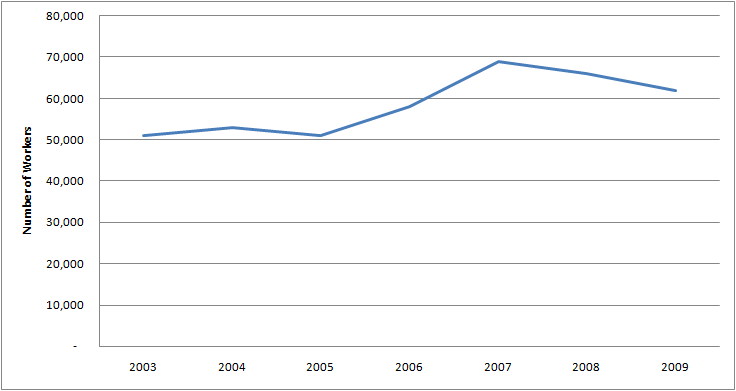
| Administrative services managers: Number of Male Workers 2003 - 2009 | |
|---|---|
| 2003 | 51,000 |
| 2004 | 53,000 |
| 2005 | 51,000 |
| 2006 | 58,000 |
| 2007 | 69,000 |
| 2008 | 66,000 |
| 2009 | 62,000 |
Graph of Number of Females with Administrative services manager Jobs in U.S. 2003 - 2009
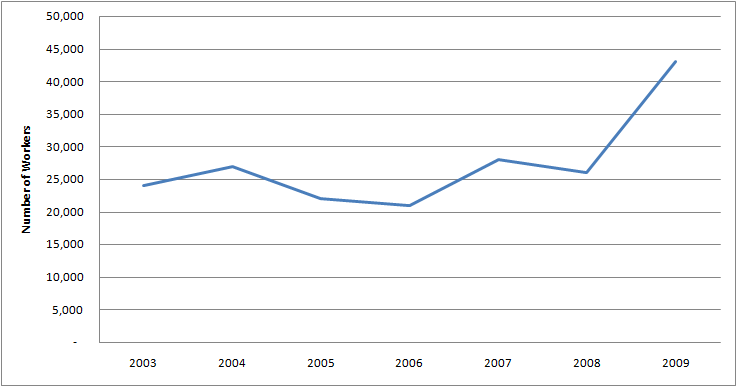
| Administrative services managers: Number of Female Workers 2003 - 2009 | |
|---|---|
| 2003 | 24,000 |
| 2004 | 27,000 |
| 2005 | 22,000 |
| 2006 | 21,000 |
| 2007 | 28,000 |
| 2008 | 26,000 |
| 2009 | 43,000 |
Graph of Average Annual Salary for Administrative services manager Jobs 2003 - 2009
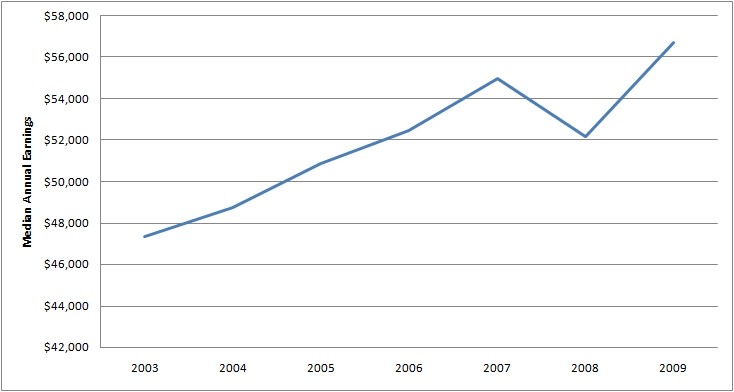
| Administrative services managers: Average Annual Salary 2003 - 2009 | |
|---|---|
| 2003 | $47,320 |
| 2004 | $48,724 |
| 2005 | $50,856 |
| 2006 | $52,468 |
| 2007 | $54,964 |
| 2008 | $52,156 |
| 2009 | $56,732 |
Graph of Average Annual Salary for Male Administrative services manager Jobs 2003 - 2009
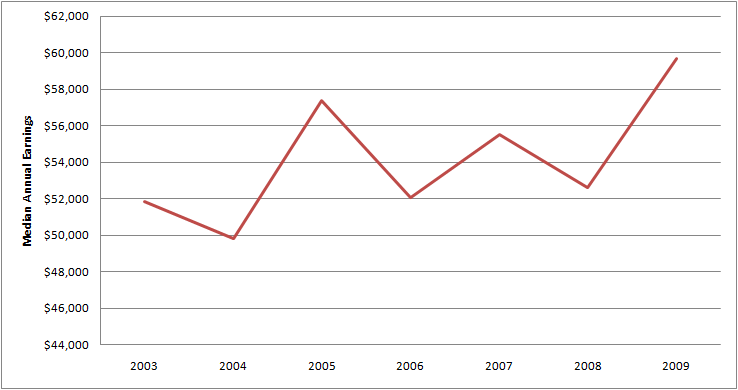
| Administrative services managers: Average Male Annual Salary 2003 - 2009 | |
|---|---|
| 2003 | $51,844 |
| 2004 | $49,816 |
| 2005 | $57,408 |
| 2006 | $52,052 |
| 2007 | $55,536 |
| 2008 | $52,624 |
| 2009 | $59,696 |
| Projected Job Openings for Administrative services managers | |
|---|---|
| Projected Employment, 2018 | 291,700 |
| Number of New Hires | 32,300 |
| Percent Change | 12 % |
| Total Job Opportunities Due to Growth and Replacement Through 2018 | 86,600 |
How to Become a Administrative services manager: Graph of Educational Background for Administrative services managers in the U.S.

| Most Significant Source of Education for Administrative services managers | |
|---|---|
| Percent with Less than High School Diploma | 2.2 % |
| Percent with High school Diploma or Equivalent | 19.3 % |
| Percent with Some College, No Degree | 28.6 % |
| Percent with Associate's Degree | 12.2 % |
| Percent with Bachelor's Degree | 27.5 % |
| Percent with Master's Degree | 8.6 % |
| Percent with Doctoral or Professional Degree | 1.6 % |
Other data sources show the following industry statistics:
Graph of Employment for Administrative services managers in the U.S. for 1997 - 2009
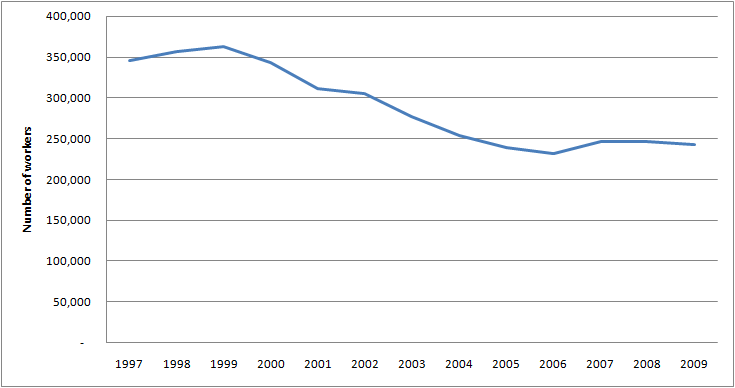
| Employment for Administrative services managers 1997 - 2009 | |
|---|---|
| 1997 | 346,600 |
| 1998 | 357,720 |
| 1999 | 363,530 |
| 2000 | 344,440 |
| 2001 | 311,600 |
| 2002 | 306,370 |
| 2003 | 278,300 |
| 2004 | 254,610 |
| 2005 | 239,410 |
| 2006 | 232,410 |
| 2007 | 246,930 |
| 2008 | 246,930 |
| 2009 | 243,580 |
Graph of Average Annual Salary for Administrative services managers for 1997 - 2009
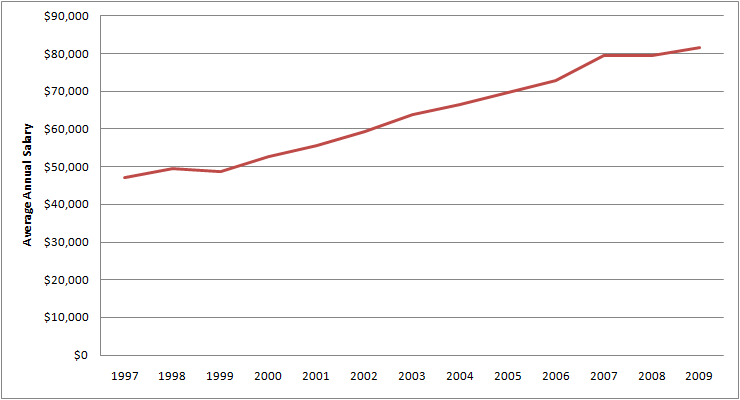
| Average Annual Salary for Administrative services managers for 1997 - 2009 | |
|---|---|
| 1997 | $47,030 |
| 1998 | $49,290 |
| 1999 | $48,580 |
| 2000 | $52,650 |
| 2001 | $55,460 |
| 2002 | $59,350 |
| 2003 | $63,780 |
| 2004 | $66,530 |
| 2005 | $69,540 |
| 2006 | $72,840 |
| 2007 | $79,500 |
| 2008 | $79,500 |
| 2009 | $81,530 |
Graph of Average Hourly Salary for Administrative services managers for 1997 - 2009
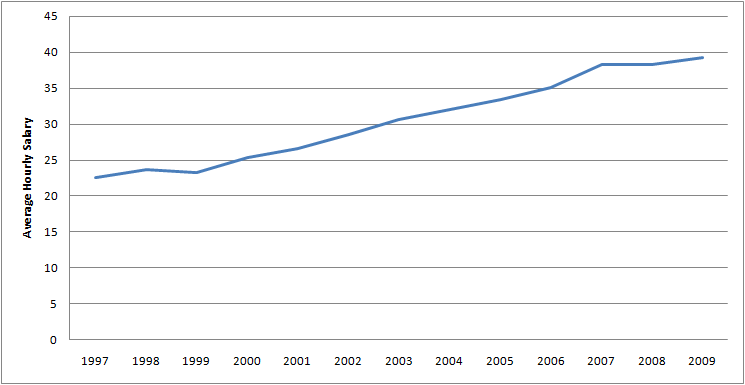
| Average Hourly Salary for Administrative services managers for 1997 - 2009 | |
|---|---|
| 1997 | $23 |
| 1998 | $24 |
| 1999 | $23.36 |
| 2000 | $25.31 |
| 2001 | $26.67 |
| 2002 | $28.54 |
| 2003 | $30.67 |
| 2004 | $31.98 |
| 2005 | $33.44 |
| 2006 | $35.02 |
| 2007 | $38.22 |
| 2008 | $38.22 |
| 2009 | $39.20 |
Table of Average Salary by State (Ordered Higest-Paying to Lowest-Paying) for Administrative services managers for 2009
| Rhode Island | $104,890 |
| New Jersey | $103,080 |
| New York | $102,950 |
| Ohio | $101,910 |
| Florida | $96,050 |
| Massachusetts | $95,140 |
| Washington | $91,970 |
| Delaware | $91,930 |
| Colorado | $89,280 |
| California | $88,100 |
| Texas | $86,540 |
| Virginia | $84,050 |
| Minnesota | $82,170 |
| Connecticut | $80,880 |
| District of Columbia | $80,290 |
| Pennsylvania | $79,840 |
| New Hampshire | $77,680 |
| Maryland | $77,520 |
| Georgia | $76,460 |
| North Carolina | $76,090 |
| Missouri | $75,620 |
| Alabama | $75,260 |
| Michigan | $75,110 |
| Iowa | $74,840 |
| South Dakota | $72,040 |
| New Mexico | $71,740 |
| Wisconsin | $71,210 |
| Oregon | $71,080 |
| Hawaii | $70,870 |
| Indiana | $70,570 |
| Kansas | $69,470 |
| Utah | $69,310 |
| South Carolina | $68,990 |
| Nevada | $68,260 |
| Kentucky | $68,140 |
| Nebraska | $67,650 |
| Alaska | $66,190 |
| Illinois | $65,370 |
| Arkansas | $64,270 |
| North Dakota | $64,020 |
| Wyoming | $63,600 |
| Maine | $62,730 |
| Tennessee | $60,440 |
| Louisiana | $59,500 |
| West Virginia | $59,300 |
| Arizona | $58,910 |
| Montana | $57,780 |
| Oklahoma | $56,830 |
| Virgin Islands | $55,400 |
| Idaho | $54,880 |
| Mississippi | $52,650 |
| Vermont | $51,670 |
| Puerto Rico | $51,300 |
| Guam | $42,170 |