Construction Managers
Construction Managers - Job Description, Average Salaries, Career Opportunities, Job Opportunities, National Labor Statistics, Injuries and Education Requirements.
Construction Manager Job Description
Construction managers oversee the work necessary to implement a construction project. This includes hiring and managing contractors, developing and implementing a project schedule and developing a budget and ensuring that the project activities do not cause an exceedance of the budget.
Graph of Number of People with Construction Manager Jobs in U.S. 2003 - 2009

| Construction Managers: Number of workers 2003 - 2009 | |
|---|---|
| 2003 | 352,000 |
| 2004 | 425,000 |
| 2005 | 430,000 |
| 2006 | 475,000 |
| 2007 | 546,000 |
| 2008 | 586,000 |
| 2009 | 454,000 |
Graph of Number of Males with Construction Manager Jobs in U.S. 2003 - 2009

| Construction Managers: Number of Male Workers 2003 - 2009 | |
|---|---|
| 2003 | 329,000 |
| 2004 | 402,000 |
| 2005 | 400,000 |
| 2006 | 439,000 |
| 2007 | 497,000 |
| 2008 | 536,000 |
| 2009 | 424,000 |
Graph of Number of Females with Construction Manager Jobs in U.S. 2003 - 2009

| Construction Managers: Number of Female Workers 2003 - 2009 | |
|---|---|
| 2003 | 23,000 |
| 2004 | 23,000 |
| 2005 | 30,000 |
| 2006 | 36,000 |
| 2007 | 48,000 |
| 2008 | 49,000 |
| 2009 | 29,000 |
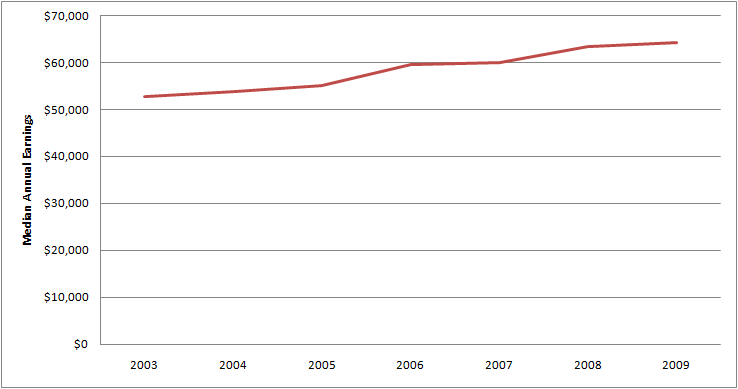
Graph of Average Annual Salary for Construction Manager Jobs 2003 - 2009

| Construction Managers: Average Annual Salary 2003 - 2009 | |
|---|---|
| 2003 | $52,728 |
| 2004 | $53,404 |
| 2005 | $54,652 |
| 2006 | $59,020 |
| 2007 | $59,436 |
| 2008 | $61,828 |
| 2009 | $63,336 |
Graph of Average Annual Salary for Male Construction Manager Jobs 2003 - 2009
| Construction Managers: Average Male Annual Salary 2003 - 2009 | |
|---|---|
| 2003 | $52,832 |
| 2004 | $53,872 |
| 2005 | $55,120 |
| 2006 | $59,540 |
| 2007 | $60,060 |
| 2008 | $63,388 |
| 2009 | $64,272 |
| Projected Job Openings for Construction Managers | |
|---|---|
| Projected Employment, 2018 | 645,800 |
| Number of New Hires | 94,800 |
| Percent Change | 17 % |
| Total Job Opportunities Due to Growth and Replacement Through 2018 | 137,700 |
How to Become a Construction Manager: Graph of Educational Background for Construction Managers in the U.S.

| Most Significant Source of Education for Construction Managers | |
|---|---|
| Percent with Less than High School Diploma | 7.8 % |
| Percent with High school Diploma or Equivalent | 30.8 % |
| Percent with Some College, No Degree | 24.6 % |
| Percent with Associate's Degree | 8.1 % |
| Percent with Bachelor's Degree | 23.2 % |
| Percent with Master's Degree | 4.8 % |
| Percent with Doctoral or Professional Degree | 0.8 % |
Other data sources show the following industry statistics:
Graph of Employment for Construction managers in the U.S. for 1997 - 2009

| Employment for Construction managers 1997 - 2009 | |
|---|---|
| 1997 | 220,560 |
| 1998 | 238,780 |
| 1999 | 240,490 |
| 2000 | 229,200 |
| 2001 | 213,960 |
| 2002 | 208,360 |
| 2003 | 196,110 |
| 2004 | 185,580 |
| 2005 | 192,610 |
| 2006 | 207,630 |
| 2007 | 220,550 |
| 2008 | 220,550 |
| 2009 | 204,760 |
Graph of Average Annual Salary for Construction managers for 1997 - 2009

| Average Annual Salary for Construction managers for 1997 - 2009 | |
|---|---|
| 1997 | $49,280 |
| 1998 | $51,920 |
| 1999 | $60,160 |
| 2000 | $63,290 |
| 2001 | $66,190 |
| 2002 | $71,210 |
| 2003 | $74,790 |
| 2004 | $78,690 |
| 2005 | $81,760 |
| 2006 | $82,760 |
| 2007 | $89,770 |
| 2008 | $89,770 |
| 2009 | $93,290 |
Graph of Average Hourly Salary for Construction managers for 1997 - 2009

| Average Hourly Salary for Construction managers for 1997 - 2009 | |
|---|---|
| 1997 | $24 |
| 1998 | $25 |
| 1999 | $28.92 |
| 2000 | $30.43 |
| 2001 | $31.82 |
| 2002 | $34.24 |
| 2003 | $35.96 |
| 2004 | $37.83 |
| 2005 | $39.31 |
| 2006 | $39.79 |
| 2007 | $43.16 |
| 2008 | $43.16 |
| 2009 | $44.85 |
Table of Average Salary by State (Ordered Higest-Paying to Lowest-Paying) for Construction managers for 2009
| New York | $134,090 |
| New Jersey | $119,760 |
| Rhode Island | $115,960 |
| Washington | $112,080 |
| California | $111,030 |
| Alaska | $109,540 |
| Massachusetts | $105,670 |
| Florida | $102,930 |
| Illinois | $102,530 |
| Connecticut | $101,170 |
| Delaware | $100,800 |
| Ohio | $99,610 |
| Hawaii | $97,710 |
| Nevada | $96,130 |
| District of Columbia | $92,590 |
| Michigan | $92,280 |
| Arizona | $91,930 |
| Pennsylvania | $90,490 |
| Virginia | $90,480 |
| Minnesota | $90,450 |
| Georgia | $89,780 |
| Maryland | $89,270 |
| North Carolina | $88,770 |
| Colorado | $84,980 |
| Indiana | $84,920 |
| Missouri | $84,600 |
| Vermont | $83,800 |
| Oregon | $82,620 |
| Wisconsin | $82,110 |
| New Hampshire | $81,840 |
| North Dakota | $81,580 |
| Iowa | $80,680 |
| Virgin Islands | $80,620 |
| South Dakota | $80,610 |
| South Carolina | $80,070 |
| Wyoming | $77,800 |
| Texas | $77,490 |
| Utah | $76,800 |
| Kansas | $76,560 |
| Alabama | $75,140 |
| Maine | $73,090 |
| Arkansas | $71,830 |
| West Virginia | $71,330 |
| Louisiana | $70,550 |
| Nebraska | $70,150 |
| New Mexico | $68,320 |
| Kentucky | $67,280 |
| Montana | $65,590 |
| Tennessee | $65,180 |
| Mississippi | $62,890 |
| Oklahoma | $62,670 |
| Idaho | $61,170 |
| Puerto Rico | $57,340 |
| Guam | $48,730 |
Table of On-the-job Fatalities for Construction managers for 2009
| On-the-job Fatalities for Construction managers for 2009 | |
|---|---|
| Total Fatalities | 55 |
| Transportation Incidents | 18 |
| Assaults and Violent Acts | 7 |
| Contact with Objects and Equipment | 6 |
| Falls | 18 |
| Exposure to Harmful Substances or Environment | 4 |
| Fires and Explosions | No Data Available |