Industrial Production Managers
Industrial Production Managers - Job Description, Average Salaries, Career Opportunities, Job Opportunities, National Labor Statistics, Injuries and Education Requirements.
Industrial Production Managers Job Description
Industrial production managers ensure that organizations such as manufacturing facilities meet production goals while maintaining quality specifications and keeping under budget. They manage and oversee several areas of the business to optimize efficiencies.
Graph of Number of People with Industrial production manager Jobs in U.S. 2003 - 2009
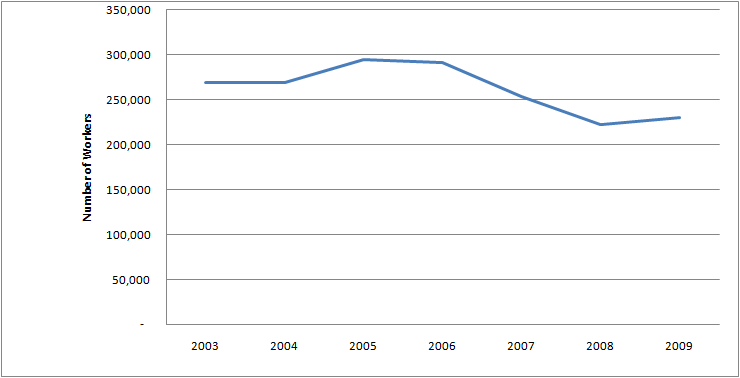
| Industrial production managers: Number of workers 2003 - 2009 | |
|---|---|
| 2003 | 269,000 |
| 2004 | 269,000 |
| 2005 | 295,000 |
| 2006 | 292,000 |
| 2007 | 253,000 |
| 2008 | 222,000 |
| 2009 | 230,000 |
Graph of Number of Males with Industrial production manager Jobs in U.S. 2003 - 2009
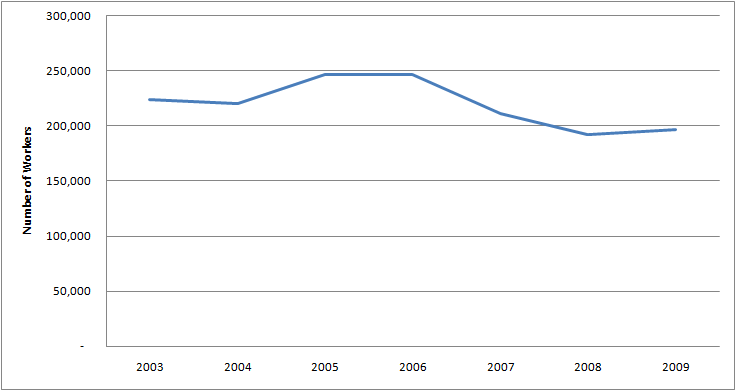
| Industrial production managers: Number of Male Workers 2003 - 2009 | |
|---|---|
| 2003 | 224,000 |
| 2004 | 220,000 |
| 2005 | 247,000 |
| 2006 | 247,000 |
| 2007 | 211,000 |
| 2008 | 192,000 |
| 2009 | 197,000 |
Graph of Number of Females with Industrial production manager Jobs in U.S. 2003 - 2009

| Industrial production managers: Number of Female Workers 2003 - 2009 | |
|---|---|
| 2003 | 45,000 |
| 2004 | 49,000 |
| 2005 | 48,000 |
| 2006 | 45,000 |
| 2007 | 41,000 |
| 2008 | 30,000 |
| 2009 | 33,000 |
Graph of Average Annual Salary for Industrial production manager Jobs 2003 - 2009
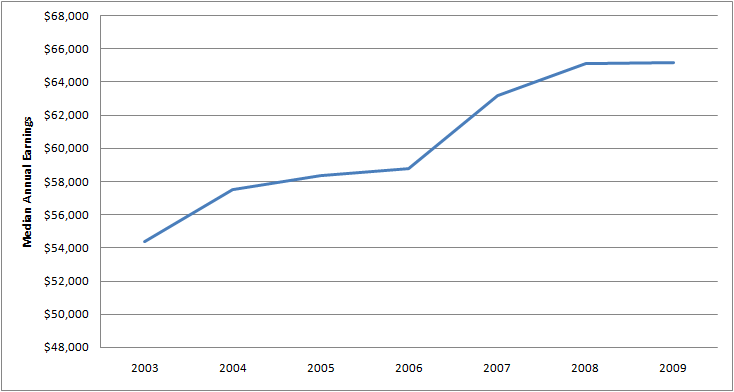
| Industrial production managers: Average Annual Salary 2003 - 2009 | |
|---|---|
| 2003 | $54,392 |
| 2004 | $57,564 |
| 2005 | $58,396 |
| 2006 | $58,812 |
| 2007 | $63,232 |
| 2008 | $65,156 |
| 2009 | $65,208 |
Graph of Average Annual Salary for Male Industrial production manager Jobs 2003 - 2009
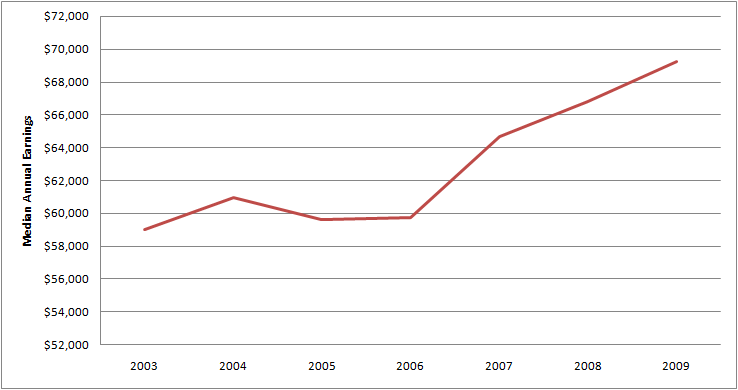
| Industrial production managers: Average Male Annual Salary 2003 - 2009 | |
|---|---|
| 2003 | $59,020 |
| 2004 | $60,944 |
| 2005 | $59,644 |
| 2006 | $59,748 |
| 2007 | $64,688 |
| 2008 | $66,820 |
| 2009 | $69,264 |
| Projected Job Openings for Industrial production managers | |
|---|---|
| Projected Employment, 2018 | 144,100 |
| Number of New Hires | -11,900 |
| Percent Change | -8 % |
| Total Job Opportunities Due to Growth and Replacement Through 2018 | 54,700 |
How to Become a Industrial production manager: Graph of Educational Background for Industrial production managers in the U.S.

| Most Significant Source of Education for Industrial production managers | |
|---|---|
| Percent with Less than High School Diploma | 3.7 % |
| Percent with High school Diploma or Equivalent | 21.8 % |
| Percent with Some College, No Degree | 23.2 % |
| Percent with Associate's Degree | 9.2 % |
| Percent with Bachelor's Degree | 30.2 % |
| Percent with Master's Degree | 10.7 % |
| Percent with Doctoral or Professional Degree | 1.2 % |
Other data sources show the following industry statistics:
Graph of Employment for Industrial production managers in the U.S. for 1997 - 2009
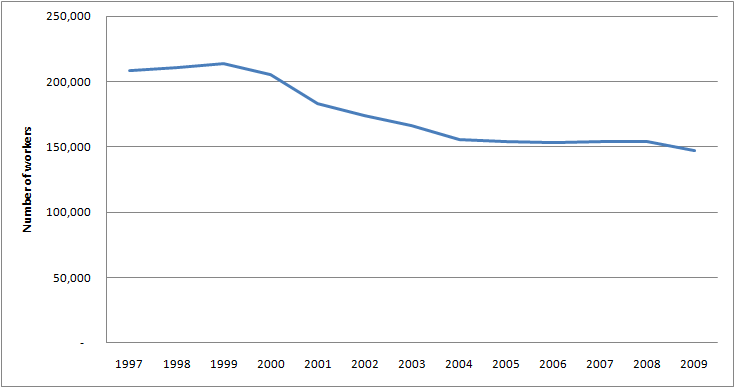
| Employment for Industrial production managers 1997 - 2009 | |
|---|---|
| 1997 | 208,000 |
| 1998 | 210,730 |
| 1999 | 213,510 |
| 2000 | 205,370 |
| 2001 | 183,050 |
| 2002 | 173,960 |
| 2003 | 166,350 |
| 2004 | 155,980 |
| 2005 | 153,950 |
| 2006 | 153,410 |
| 2007 | 154,030 |
| 2008 | 154,030 |
| 2009 | 147,250 |
Graph of Average Annual Salary for Industrial production managers for 1997 - 2009
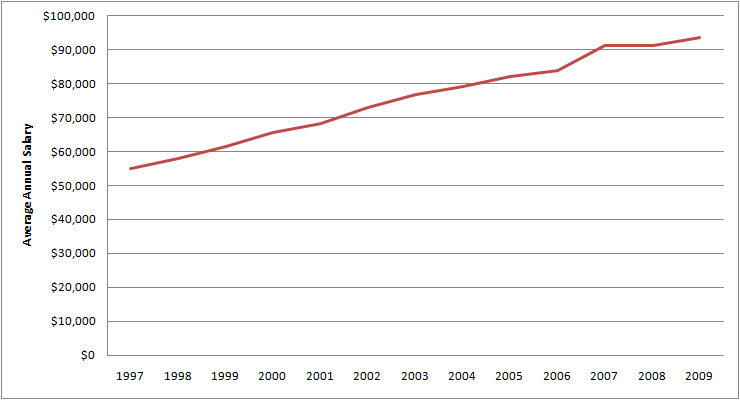
| Average Annual Salary for Industrial production managers for 1997 - 2009 | |
|---|---|
| 1997 | $54,860 |
| 1998 | $57,800 |
| 1999 | $61,480 |
| 2000 | $65,620 |
| 2001 | $68,310 |
| 2002 | $72,980 |
| 2003 | $76,710 |
| 2004 | $79,170 |
| 2005 | $81,960 |
| 2006 | $83,970 |
| 2007 | $91,200 |
| 2008 | $91,200 |
| 2009 | $93,650 |
Graph of Average Hourly Salary for Industrial production managers for 1997 - 2009
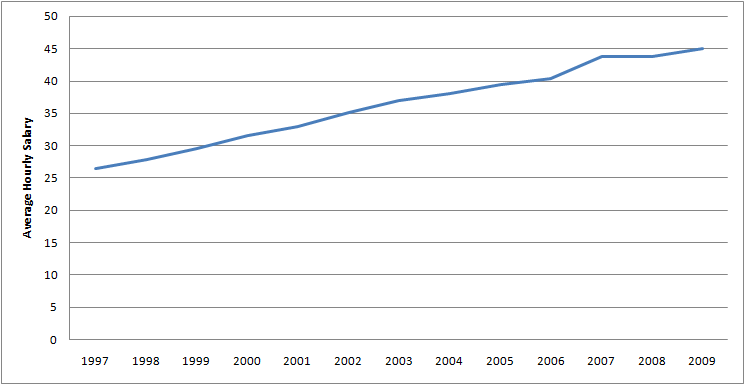
| Average Hourly Salary for Industrial production managers for 1997 - 2009 | |
|---|---|
| 1997 | $26 |
| 1998 | $28 |
| 1999 | $29.56 |
| 2000 | $31.55 |
| 2001 | $32.84 |
| 2002 | $35.09 |
| 2003 | $36.88 |
| 2004 | $38.06 |
| 2005 | $39.41 |
| 2006 | $40.37 |
| 2007 | $43.85 |
| 2008 | $43.85 |
| 2009 | $45.03 |
Table of Average Salary by State (Ordered Higest-Paying to Lowest-Paying) for Industrial production managers for 2009
| Texas | $114,090 |
| New Jersey | $111,720 |
| Delaware | $106,830 |
| Massachusetts | $104,340 |
| Washington | $103,380 |
| New York | $101,740 |
| Puerto Rico | $100,880 |
| Michigan | $100,470 |
| California | $100,180 |
| Florida | $97,460 |
| Maryland | $97,340 |
| Minnesota | $96,770 |
| New Mexico | $95,800 |
| Virginia | $94,760 |
| Connecticut | $94,740 |
| Rhode Island | $94,690 |
| Louisiana | $92,960 |
| Ohio | $92,540 |
| Iowa | $92,500 |
| Colorado | $91,640 |
| New Hampshire | $90,630 |
| Vermont | $89,380 |
| Wyoming | $89,130 |
| Oregon | $88,590 |
| Indiana | $88,280 |
| Arizona | $88,180 |
| Pennsylvania | $87,480 |
| Illinois | $87,060 |
| Utah | $86,860 |
| South Carolina | $86,640 |
| Missouri | $85,820 |
| Hawaii | $84,700 |
| West Virginia | $84,430 |
| Nebraska | $83,720 |
| Maine | $83,450 |
| South Dakota | $83,030 |
| Wisconsin | $82,550 |
| North Carolina | $82,140 |
| Alabama | $81,950 |
| Nevada | $81,110 |
| Georgia | $80,920 |
| Kentucky | $80,600 |
| Alaska | $78,520 |
| Idaho | $77,540 |
| Arkansas | $77,330 |
| Mississippi | $76,270 |
| Oklahoma | $74,870 |
| Kansas | $73,560 |
| Tennessee | $72,400 |
| Montana | $70,780 |
| North Dakota | $70,480 |
Table of On-the-job Fatalities for Industrial production managers for 2009
| On-the-job Fatalities for Industrial production managers for 2009 | |
|---|---|
| Total Fatalities | 5 |
| Transportation Incidents | No Data Available |
| Assaults and Violent Acts | No Data Available |
| Contact with Objects and Equipment | No Data Available |
| Falls | No Data Available |
| Exposure to Harmful Substances or Environment | No Data Available |
| Fires and Explosions | No Data Available |