Sales Managers
Sales Managers - Job Description, Average Salaries, Career Opportunities, Job Opportunities, National Labor Statistics, Injuries and Education Requirements.
Sales Manager Job Description
Sales managers determine sales areas, quotas and distribution of sales and analyze sales data to figure out customer preferences and set the sales quotas.
Graph of Number of People with Sales Manager Jobs in U.S. 2003 - 2009

| Sales Managers: Number of workers 2003 - 2009 | |
|---|---|
| 2003 | 800,000 |
| 2004 | 770,000 |
| 2005 | 728,000 |
| 2006 | 805,000 |
| 2007 | 784,000 |
| 2008 | 867,000 |
| 2009 | 857,000 |
Graph of Number of Males with Sales Manager Jobs in U.S. 2003 - 2009
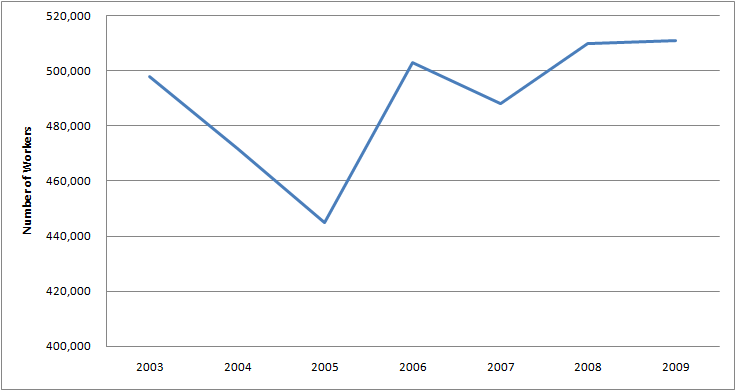
| Sales Managers: Number of Male Workers 2003 - 2009 | |
|---|---|
| 2003 | 498,000 |
| 2004 | 472,000 |
| 2005 | 445,000 |
| 2006 | 503,000 |
| 2007 | 488,000 |
| 2008 | 510,000 |
| 2009 | 511,000 |
Graph of Number of Females with Sales Manager Jobs in U.S. 2003 - 2009
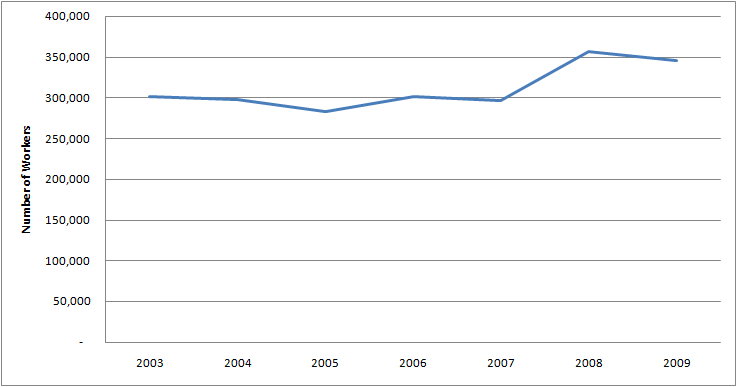
| Sales Managers: Number of Female Workers 2003 - 2009 | |
|---|---|
| 2003 | 302,000 |
| 2004 | 298,000 |
| 2005 | 283,000 |
| 2006 | 302,000 |
| 2007 | 296,000 |
| 2008 | 357,000 |
| 2009 | 346,000 |
Graph of Average Annual Salary for Sales Manager Jobs 2003 - 2009

| Sales Managers: Average Annual Salary 2003 - 2009 | |
|---|---|
| 2003 | $58,604 |
| 2004 | $63,076 |
| 2005 | $64,220 |
| 2006 | $68,432 |
| 2007 | $68,588 |
| 2008 | $69,940 |
| 2009 | $69,160 |
Graph of Average Annual Salary for Male Sales Manager Jobs 2003 - 2009

| Sales Managers: Average Male Annual Salary 2003 - 2009 | |
|---|---|
| 2003 | $66,092 |
| 2004 | $74,932 |
| 2005 | $74,880 |
| 2006 | $77,064 |
| 2007 | $78,572 |
| 2008 | $83,252 |
| 2009 | $79,872 |
Graph of Average Annual Salary for Female Sales Manager Jobs 2003 - 2009

| Sales Managers: Average Female Annual Salary 2003 - 2009 | |
|---|---|
| 2003 | $47,008 |
| 2004 | $46,696 |
| 2005 | $51,480 |
| 2006 | $51,220 |
| 2007 | $53,456 |
| 2008 | $53,248 |
| 2009 | $54,704 |
| Projected Job Openings for Sales Managers | |
|---|---|
| Projected Employment, 2018 | 596,200 |
| Number of New Hires | 73,700 |
| Percent Change | 14 % |
| Total Job Opportunities Due to Growth and Replacement Through 2018 | 186,300 |
Other data sources show the following industry statistics:
Graph of Employment for Sales managers in the U.S. for 1997 - 2009
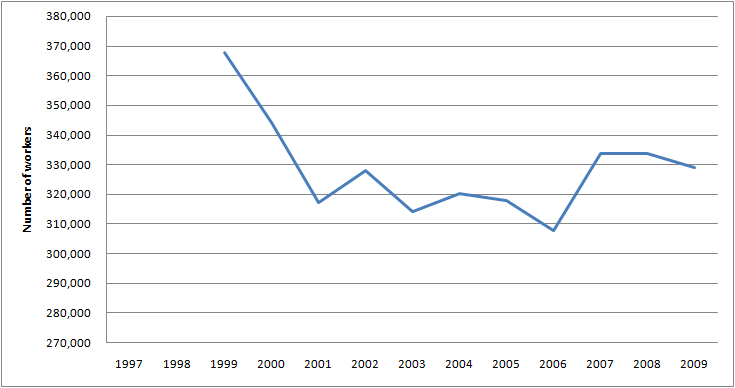
| Employment for Sales managers 1997 - 2009 | |
|---|---|
| 1997 | No Data Available |
| 1998 | No Data Available |
| 1999 | 367,640 |
| 2000 | 344,180 |
| 2001 | 317,410 |
| 2002 | 328,060 |
| 2003 | 314,180 |
| 2004 | 320,240 |
| 2005 | 317,970 |
| 2006 | 307,960 |
| 2007 | 333,910 |
| 2008 | 333,910 |
| 2009 | 328,980 |
Graph of Average Annual Salary for Sales managers for 1997 - 2009

| Average Annual Salary for Sales managers for 1997 - 2009 | |
|---|---|
| 1997 | No Data Available |
| 1998 | No Data Available |
| 1999 | $69,560 |
| 2000 | $74,230 |
| 2001 | $77,000 |
| 2002 | $86,110 |
| 2003 | $91,840 |
| 2004 | $95,010 |
| 2005 | $98,510 |
| 2006 | $102,730 |
| 2007 | $110,390 |
| 2008 | $110,390 |
| 2009 | $111,570 |
Graph of Average Hourly Salary for Sales managers for 1997 - 2009
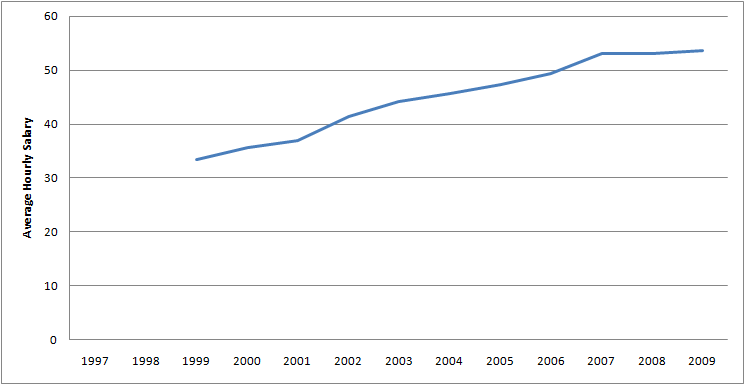
| Average Hourly Salary for Sales managers for 1997 - 2009 | |
|---|---|
| 1997 | No Data Available |
| 1998 | No Data Available |
| 1999 | $33.44 |
| 2000 | $35.69 |
| 2001 | $37.02 |
| 2002 | $41.40 |
| 2003 | $44.15 |
| 2004 | $45.68 |
| 2005 | $47.36 |
| 2006 | $49.39 |
| 2007 | $53.07 |
| 2008 | $53.07 |
| 2009 | $53.64 |
Table of Average Salary by State (Ordered Higest-Paying to Lowest-Paying) for Sales managers for 2009
| New York | $156,800 |
| Delaware | $134,430 |
| Massachusetts | $134,300 |
| New Jersey | $132,950 |
| Florida | $126,710 |
| New Hampshire | $123,600 |
| Washington | $120,590 |
| Rhode Island | $120,290 |
| Connecticut | $116,220 |
| California | $115,930 |
| Maryland | $113,820 |
| Texas | $113,660 |
| Ohio | $110,460 |
| Pennsylvania | $110,030 |
| Colorado | $109,910 |
| Virginia | $109,150 |
| District of Columbia | $109,110 |
| South Dakota | $108,680 |
| Oregon | $108,430 |
| Minnesota | $107,210 |
| Georgia | $107,200 |
| Nebraska | $107,160 |
| Missouri | $107,150 |
| Illinois | $105,050 |
| Michigan | $104,670 |
| Kansas | $102,700 |
| Wisconsin | $102,400 |
| Utah | $101,130 |
| South Carolina | $100,230 |
| North Carolina | $98,790 |
| Iowa | $95,890 |
| Alabama | $95,300 |
| Arkansas | $95,170 |
| Indiana | $93,780 |
| Arizona | $92,830 |
| Vermont | $90,890 |
| Kentucky | $90,540 |
| Tennessee | $88,960 |
| Oklahoma | $86,020 |
| Maine | $85,840 |
| Nevada | $85,360 |
| Hawaii | $84,050 |
| North Dakota | $83,110 |
| Mississippi | $82,900 |
| New Mexico | $82,210 |
| Louisiana | $81,240 |
| Idaho | $78,590 |
| West Virginia | $77,550 |
| Montana | $76,000 |
| Wyoming | $73,960 |
| Alaska | $70,640 |
| Puerto Rico | $69,270 |
| Virgin Islands | $61,530 |
| Guam | $43,600 |
Table of On-the-job Fatalities for Sales managers for 2009
| On-the-job Fatalities for Sales managers for 2009 | |
|---|---|
| Total Fatalities | 5 |
| Transportation Incidents | 3 |
| Assaults and Violent Acts | No Data Available |
| Contact with Objects and Equipment | No Data Available |
| Falls | No Data Available |
| Exposure to Harmful Substances or Environment | No Data Available |
| Fires and Explosions | No Data Available |