Chief executives
Chief executives - Job Description, Average Salaries, Career Opportunities, Job Opportunities, National Labor Statistics, Injuries and Education Requirements.
Chief Executive Job Description
A chief executive is the top official in an organization and is generally in charge of managing the direction and vision for the organization. The chief executive should have a goal or strategy for the future of the company, and his/her duties revolve around ensuring the organization achieves the goals.
Graph of Number of People with Chief Executive Jobs in U.S. 2003 - 2009
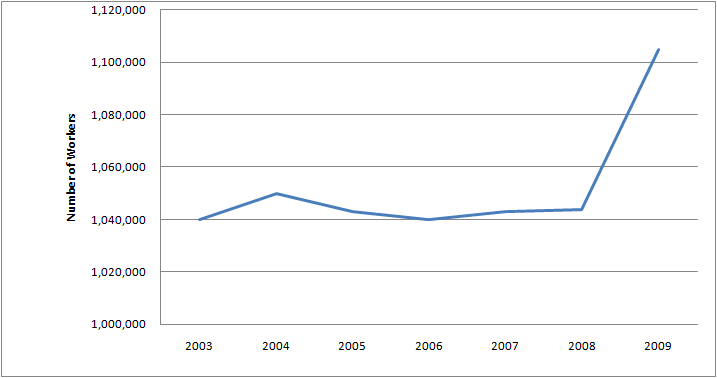
| Chief executives: Number of workers 2003 - 2009 | |
|---|---|
| 2003 | 1,040,000 |
| 2004 | 1,050,000 |
| 2005 | 1,043,000 |
| 2006 | 1,040,000 |
| 2007 | 1,043,000 |
| 2008 | 1,044,000 |
| 2009 | 1,105,000 |
Graph of Number of Males with Chief Executive Jobs in U.S. 2003 - 2009
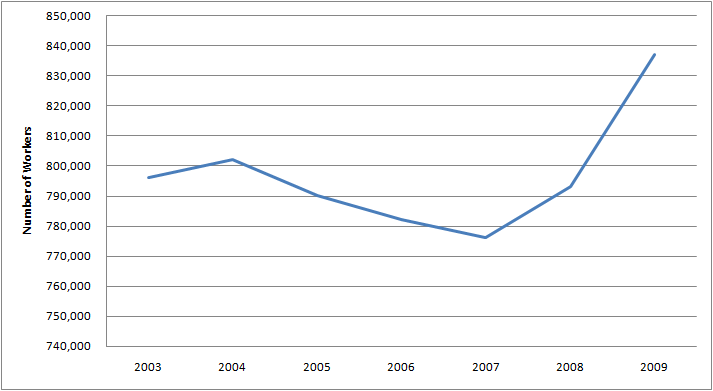
| Chief executives: Number of Male Workers 2003 - 2009 | |
|---|---|
| 2003 | 796,000 |
| 2004 | 802,000 |
| 2005 | 790,000 |
| 2006 | 782,000 |
| 2007 | 776,000 |
| 2008 | 793,000 |
| 2009 | 837,000 |
Graph of Number of Females with Chief Executive Jobs in U.S. 2003 - 2009
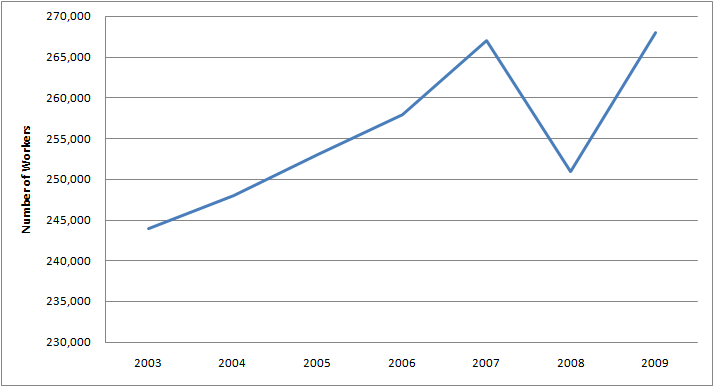
| Chief executives: Number of Female Workers 2003 - 2009 | |
|---|---|
| 2003 | 244,000 |
| 2004 | 248,000 |
| 2005 | 253,000 |
| 2006 | 258,000 |
| 2007 | 267,000 |
| 2008 | 251,000 |
| 2009 | 268,000 |
Graph of Average Annual Salary for Chief Executive Jobs 2003 - 2009
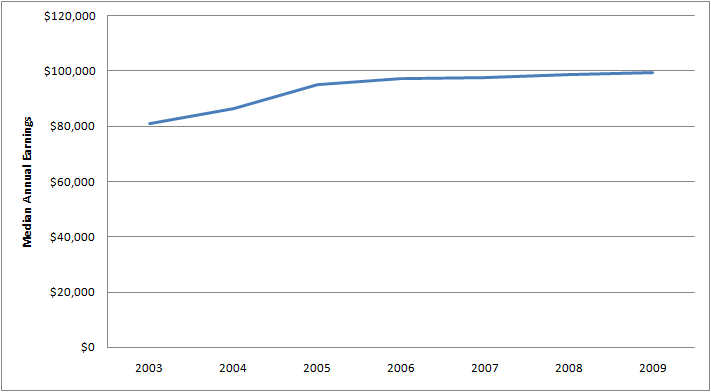
| Chief executives: Average Annual Salary 2003 - 2009 | |
|---|---|
| 2003 | $81,016 |
| 2004 | $86,476 |
| 2005 | $95,368 |
| 2006 | $97,500 |
| 2007 | $97,864 |
| 2008 | $98,956 |
| 2009 | $99,632 |
Graph of Average Annual Salary for Male Chief Executive Jobs 2003 - 2009

| Chief executives: Average Male Annual Salary 2003 - 2009 | |
|---|---|
| 2003 | $90,272 |
| 2004 | $97,500 |
| 2005 | $98,956 |
| 2006 | $99,164 |
| 2007 | $99,736 |
| 2008 | $103,948 |
| 2009 | $108,368 |
Graph of Average Annual Salary for Female Chief Executive Jobs 2003 - 2009
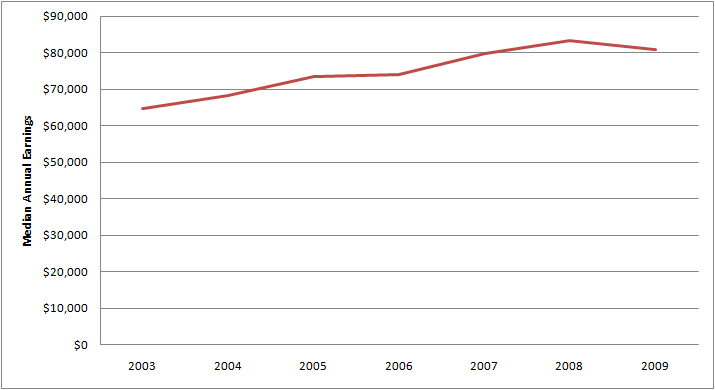
| Chief executives: Average Female Annual Salary 2003 - 2009 | |
|---|---|
| 2003 | $64,636 |
| 2004 | $68,120 |
| 2005 | $73,476 |
| 2006 | $73,944 |
| 2007 | $79,872 |
| 2008 | $83,356 |
| 2009 | $80,756 |
| Projected Job Openings for Chief executives | |
|---|---|
| Projected Employment, 2018 | 394,900 |
| Number of New Hires | -5,500 |
| Percent Change | -1 % |
| Total Job Opportunities Due to Growth and Replacement Through 2018 | 112,500 |
How to Become a Chief Executive: Graph of Educational Background for Chief executives in the U.S.

| Most Significant Source of Education for Chief executives | |
|---|---|
| Percent with Less than High School Diploma | 1.8 % |
| Percent with High school Diploma or Equivalent | 11.9 % |
| Percent with Some College, No Degree | 16.9 % |
| Percent with Associate's Degree | 5.7 % |
| Percent with Bachelor's Degree | 38.6 % |
| Percent with Master's Degree | 19.0 % |
| Percent with Doctoral or Professional Degree | 6.2 % |
Other data sources show the following industry statistics:
Graph of Employment for Chief Executives in the U.S. for 1997 - 2009
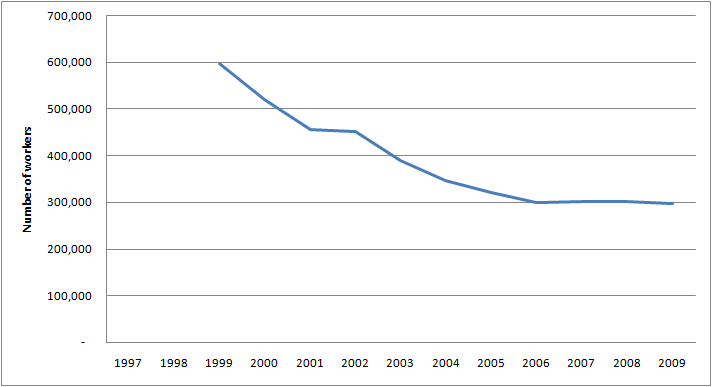
| Employment for Chief Executives 1997 - 2009 | |
|---|---|
| 1997 | No Data Available |
| 1998 | No Data Available |
| 1999 | 597,060 |
| 2000 | 519,890 |
| 2001 | 455,930 |
| 2002 | 452,400 |
| 2003 | 389,880 |
| 2004 | 346,590 |
| 2005 | 321,300 |
| 2006 | 299,520 |
| 2007 | 301,930 |
| 2008 | 301,930 |
| 2009 | 297,640 |
Graph of Average Annual Salary for Chief Executives for 1997 - 2009
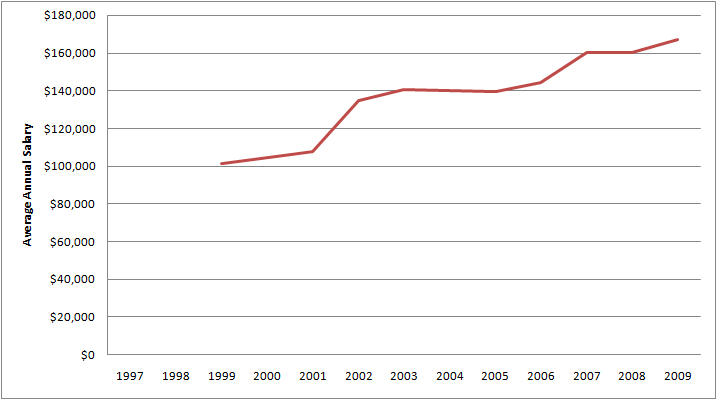
| Average Annual Salary for Chief Executives for 1997 - 2009 | |
|---|---|
| 1997 | No Data Available |
| 1998 | No Data Available |
| 1999 | $101,240 |
| 2000 | $104,630 |
| 2001 | $107,670 |
| 2002 | $134,960 |
| 2003 | $140,580 |
| 2004 | $139,920 |
| 2005 | $139,810 |
| 2006 | $144,600 |
| 2007 | $160,440 |
| 2008 | $160,440 |
| 2009 | $167,280 |
Graph of Average Hourly Salary for Chief Executives for 1997 - 2009
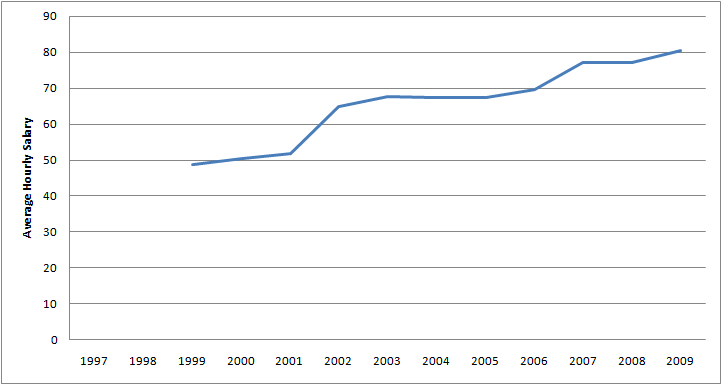
| Average Hourly Salary for Chief Executives for 1997 - 2009 | |
|---|---|
| 1997 | No Data Available |
| 1998 | No Data Available |
| 1999 | $48.67 |
| 2000 | $50.30 |
| 2001 | $51.77 |
| 2002 | $64.89 |
| 2003 | $67.58 |
| 2004 | $67.27 |
| 2005 | $67.22 |
| 2006 | $69.52 |
| 2007 | $77.13 |
| 2008 | $77.13 |
| 2009 | $80.43 |
Table of Average Salary by State (Ordered Higest-Paying to Lowest-Paying) for Chief Executives for 2009
| Delaware | $201,460 |
| New Mexico | $197,230 |
| New Jersey | $196,220 |
| California | $195,700 |
| Connecticut | $190,940 |
| North Carolina | $189,860 |
| Washington | $188,220 |
| New York | $184,740 |
| District of Columbia | $184,640 |
| Rhode Island | $180,180 |
| Virginia | $180,130 |
| Massachusetts | $177,980 |
| Oregon | $177,280 |
| Florida | $176,510 |
| Minnesota | $174,710 |
| Texas | $172,280 |
| Ohio | $171,110 |
| New Hampshire | $170,640 |
| Wisconsin | $169,170 |
| Nebraska | $167,790 |
| Colorado | $167,480 |
| Arizona | $167,190 |
| Alabama | $166,350 |
| Maryland | $166,160 |
| South Carolina | $165,630 |
| Nevada | $165,060 |
| Indiana | $164,130 |
| Georgia | $163,120 |
| Hawaii | $161,370 |
| Pennsylvania | $159,580 |
| Michigan | $157,920 |
| Illinois | $153,720 |
| Tennessee | $152,650 |
| Missouri | $150,040 |
| Virgin Islands | $149,810 |
| Louisiana | $148,580 |
| Utah | $146,990 |
| Alaska | $145,290 |
| Iowa | $144,680 |
| Kansas | $139,340 |
| Arkansas | $136,930 |
| Kentucky | $136,510 |
| North Dakota | $136,370 |
| Idaho | $134,310 |
| Vermont | $133,730 |
| Maine | $132,770 |
| South Dakota | $129,620 |
| Mississippi | $128,680 |
| Wyoming | $123,990 |
| Oklahoma | $118,110 |
| Puerto Rico | $107,980 |
| West Virginia | $102,610 |
| Montana | $90,260 |
| Guam | $85,670 |
Table of On-the-job Fatalities for Chief Executives for 2009
| On-the-job Fatalities for Chief Executives for 2009 | |
|---|---|
| Total Fatalities | 18 |
| Transportation Incidents | 12 |
| Assaults and Violent Acts | 5 |
| Contact with Objects and Equipment | No Data Available |
| Falls | No Data Available |
| Exposure to Harmful Substances or Environment | No Data Available |
| Fires and Explosions | No Data Available |