Legislators
Legislators - Job Description, Average Salaries, Career Opportunities, Job Opportunities, National Labor Statistics, Injuries and Education Requirements.
Legislator Job Description
Legislators are people who are elected to the legislature to develop, create and pass laws. Legislators can be in the senate or the house of representatives at the state or federal level.
Graph of Number of People with Legislator Jobs in U.S. 2003 - 2009
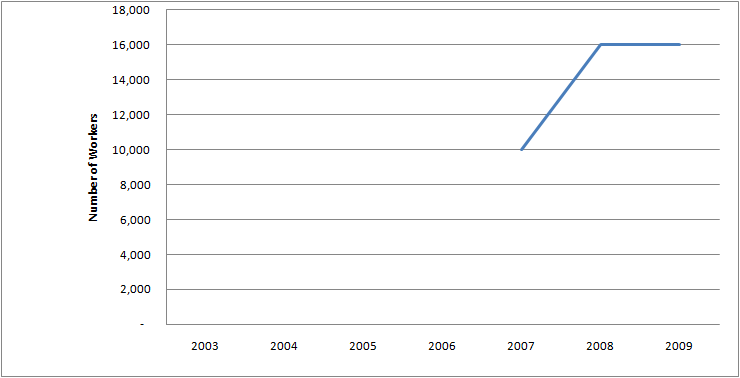
| Legislators: Number of workers 2003 - 2009 | |
|---|---|
| 2003 | No Data Available |
| 2004 | No Data Available |
| 2005 | No Data Available |
| 2006 | No Data Available |
| 2007 | 10,000 |
| 2008 | 16,000 |
| 2009 | 16,000 |
Graph of Number of Males with Legislator Jobs in U.S. 2003 - 2009
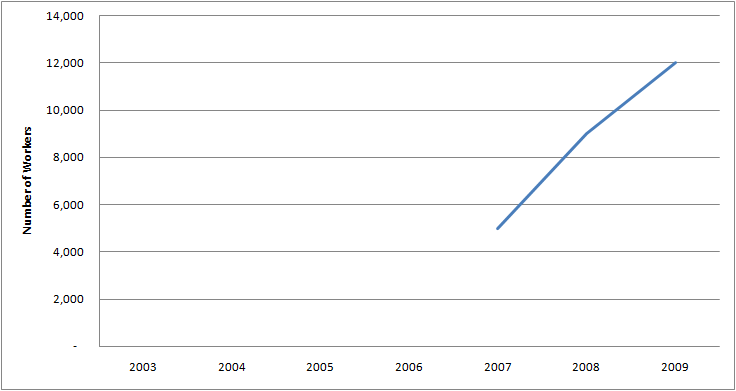
| Legislators: Number of Male Workers 2003 - 2009 | |
|---|---|
| 2003 | No Data Available |
| 2004 | No Data Available |
| 2005 | No Data Available |
| 2006 | No Data Available |
| 2007 | 5,000 |
| 2008 | 9,000 |
| 2009 | 12,000 |
Graph of Number of Females with Legislator Jobs in U.S. 2003 - 2009
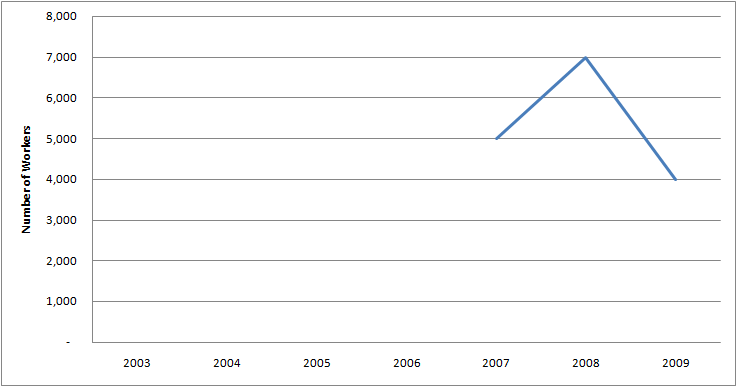
| Legislators: Number of Female Workers 2003 - 2009 | |
|---|---|
| 2003 | No Data Available |
| 2004 | No Data Available |
| 2005 | No Data Available |
| 2006 | No Data Available |
| 2007 | 5,000 |
| 2008 | 7,000 |
| 2009 | 4,000 |
| Projected Job Openings for Legislators | |
|---|---|
| Projected Employment, 2018 | 68,100 |
| Number of New Hires | 500 |
| Percent Change | 1 % |
| Total Job Opportunities Due to Growth and Replacement Through 2018 | 19,700 |
How to Become a Legislator: Graph of Educational Background for Legislators in the U.S.
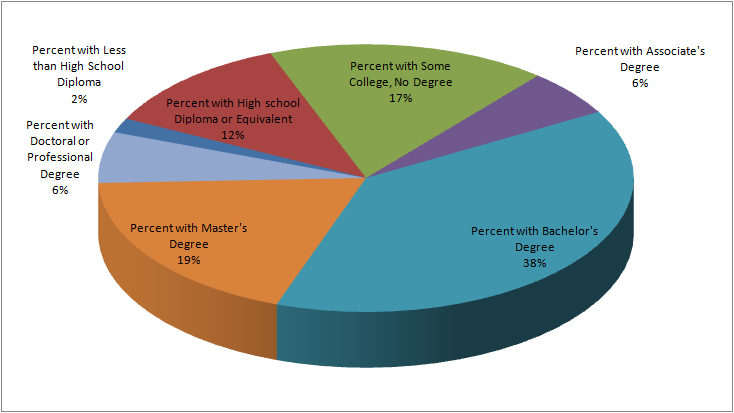
| Most Significant Source of Education for Legislators | |
|---|---|
| Percent with Less than High School Diploma | 1.8 % |
| Percent with High school Diploma or Equivalent | 11.9 % |
| Percent with Some College, No Degree | 16.9 % |
| Percent with Associate's Degree | 5.7 % |
| Percent with Bachelor's Degree | 38.6 % |
| Percent with Master's Degree | 19.0 % |
| Percent with Doctoral or Professional Degree | 6.2 % |
Other data sources show the following industry statistics:
Graph of Employment for Legislators in the U.S. for 1997 - 2009
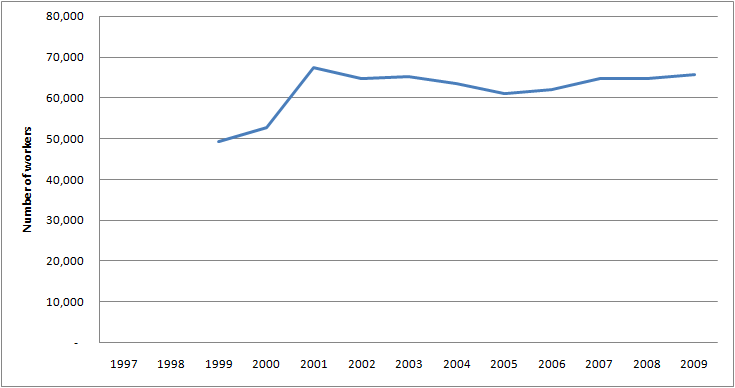
| Employment for Legislators 1997 - 2009 | |
|---|---|
| 1997 | No Data Available |
| 1998 | No Data Available |
| 1999 | 49,330 |
| 2000 | 52,750 |
| 2001 | 67,400 |
| 2002 | 64,650 |
| 2003 | 65,280 |
| 2004 | 63,440 |
| 2005 | 61,060 |
| 2006 | 62,020 |
| 2007 | 64,650 |
| 2008 | 64,650 |
| 2009 | 65,750 |
Graph of Average Annual Salary for Legislators for 1997 - 2009
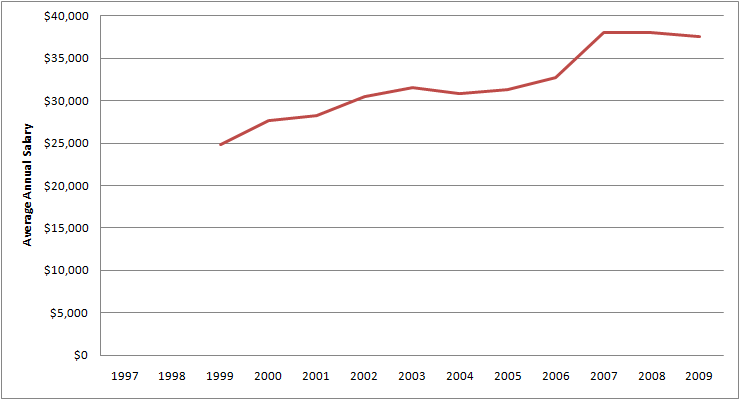
| Average Annual Salary for Legislators for 1997 - 2009 | |
|---|---|
| 1997 | No Data Available |
| 1998 | No Data Available |
| 1999 | $24,790 |
| 2000 | $27,650 |
| 2001 | $28,170 |
| 2002 | $30,420 |
| 2003 | $31,490 |
| 2004 | $30,750 |
| 2005 | $31,320 |
| 2006 | $32,730 |
| 2007 | $37,980 |
| 2008 | $37,980 |
| 2009 | $37,530 |
Graph of Average Hourly Salary for Legislators for 1997 - 2009
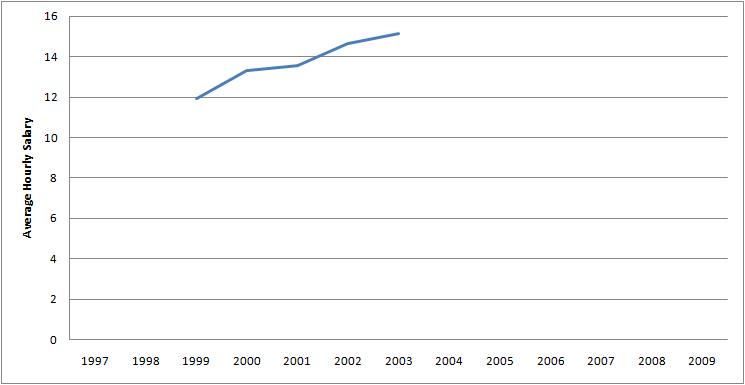
| Average Hourly Salary for Legislators for 1997 - 2009 | |
|---|---|
| 1997 | No Data Available |
| 1998 | No Data Available |
| 1999 | $11.92 |
| 2000 | $13.29 |
| 2001 | $13.54 |
| 2002 | $14.62 |
| 2003 | $15.14 |
| 2004 | No Data Available |
| 2005 | No Data Available |
| 2006 | No Data Available |
| 2007 | No Data Available |
| 2008 | No Data Available |
| 2009 | No Data Available |
Table of Average Salary by State (Ordered Higest-Paying to Lowest-Paying) for Legislators for 2009
| Indiana | $91,460 |
| New York | $76,230 |
| Puerto Rico | $62,450 |
| Washington | $57,070 |
| Arizona | $52,420 |
| California | $51,010 |
| Hawaii | $45,150 |
| Kansas | $44,330 |
| Michigan | $37,230 |
| Maryland | $37,210 |
| Arkansas | $37,030 |
| Florida | $36,170 |
| New Jersey | $35,810 |
| South Dakota | $35,480 |
| Colorado | $35,170 |
| Oregon | $33,920 |
| Pennsylvania | $33,040 |
| Wyoming | $30,990 |
| Oklahoma | $29,880 |
| Texas | $29,260 |
| Illinois | $28,830 |
| Missouri | $28,730 |
| Utah | $28,710 |
| Nevada | $28,490 |
| Connecticut | $28,200 |
| Mississippi | $28,130 |
| Montana | $27,860 |
| West Virginia | $26,690 |
| Virginia | $24,780 |
| Maine | $23,920 |
| New Mexico | $23,490 |
| Nebraska | $22,840 |
| Iowa | $22,370 |
| Georgia | $21,170 |
| Tennessee | $20,850 |
| Minnesota | $20,420 |
| Alabama | $18,840 |
| Wisconsin | $18,670 |
| Louisiana | $18,460 |
| Rhode Island | $17,990 |
| South Carolina | $17,090 |
| New Hampshire | $16,680 |
| Alaska | $0 |
| Delaware | $0 |
| North Dakota | $0 |
| Massachusetts | $0 |