Personal Distribution - Income Distribution
Correction: Per Capita
Distribution of Income Not Shown Another "correction" is that the larger families usually have larger incomes. Table 4 shows the median incomes of the various sized family units (including the unrelated individuals). You will see that the median income of unrelated individuals was a little more than $1,000 in 1950, while the median income of families with two people was $2,800. The median income increased with the size of the family up to the six-person family. This relation between size of family and median income is probably due to the factors we have already discussed above, namely age (older persons have larger families) and multiple earners per family.
Correction:
Occupational Costs Not Shown The higher incomes go to the persons who must spend time and money acquiring skills. Table 5 shows the median incomes of families classified by the occupation of the head of the family. You will note that the median incomes in Group A are markedly higher than those in Group B. You will also note that Group A occupations typically require more years of preparation than do Group B occupations. To make Group A incomes strictly comparable to Group B occupations we should deduct an allowance for what might be called the "cost of investment in skills." Were both groups to get the same annual incomes those in Group occupations requiring more preparation—would be at a disadvantage: they or their families would get no return for financing their education and apprenticeship.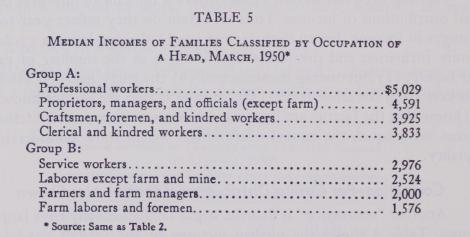
Correction:
Income-Distribution Figures Ignore Differences in Costs of Living Were we to use income-distribution 'figures for welfare purposes, we should also have to consider the differences in the costs of living of the various income classes. We could take account of certain obvious differences. The cost of living in cities is larger than in the country, and median incomes of urban families are larger than those of rural families. In 1950 the median income of urban families was about $3,700 while the median incomes of rural nonfarm and rural farm families was about $3,000 and $2,000 respectively. Corrected for differences in the costs of living, the difference between urban and rural incomes would be much less marked, although urban incomes would probably still be higher than rural incomes. Then, too, the upper-income classes tend to have certain expenses or financial obligations associated with their jobs not borne by the lower-income classes: they must do more entertaining, belong to more clubs, contribute more to charitable organizations, and so on. Were account taken of these differences in financial obligations associated with differences in income, the inequalities of income would be less marked.
Correction: Redistribution via Government Taxes and Benefits Not Shown Another correction is necessitated by taxes and governmental benefits. The income-distribution figures we have been considering do contain transfer payments, such as unemployment benefits, old-age pensions, and the like. They do not, however, show the effects of taxes on the distribution of income. Nor do they show the effects of governmental benefits other than transfer payments. The income-distribution figures we have been considering exaggerate the inequalities of income. Measured after taxes and benefits, we would find the income of the nation to be more equally distributed than before taxes and benefits. Consider the reasons.